Full Report
The numbers behind Oscar Health, Inc.: as-reported financial statements and company metrics for FY2021–FY2025, traced to the source filings, opened with the share-price history those statements have to justify. Every linked figure opens the exact page of the filing it was printed on, with the statement row highlighted. Amounts in US$ thousands unless noted.
Reading notes: All figures are in US$ thousands, the scale Oscar Health prints on every statement page ('(in thousands, except per share amounts)'). Per-share rows are in dollars and Medical Loss Ratio is a percentage. Oscar reports as a single reportable segment, so the revenue breakdown is the Company's own revenue disaggregation from the Consolidated Statements of Operations (Premium, Investment income, Other revenues) rather than a segment cut. Presentation change: the FY2024 Form 10-K recast the income statement into Premium / Investment income / Services and other revenue and Medical / Selling, general, and administrative / Depreciation and amortization expense. FY2022-FY2024 are therefore cited to the FY2024 Form 10-K, the earliest filing in the corpus that prints those years in the current format. FY2021 is cited to the FY2021 Form 10-K's original presentation, in which Premium appears as 'Premiums earned' and Medical as 'Claims incurred, net'. FY2021 Investment income, Other revenues and Selling, general, and administrative are shown as not available: the FY2021 presentation combined investment income with other revenue and split operating costs into Other insurance costs, General and administrative expenses, Federal and state assessments and Premium deficiency reserve, and no filing in the corpus recasts FY2021 into the current format.
Share Price — Full Available History — 5 Years
The stock closed at $28.34 on Jul 27, 2026 — down 19% over the window shown (-3.7% a year), trading between $2.15 and $36.77.
Source: market price feed, weekly closes, sampled from 1,357 source observations, Mar 2021–Jul 2026. Price return only, excludes dividends.
Market capitalization $817mn and enterprise value -$1.5bn.
Market cap = 28.8M shares outstanding × the Jul 27, 2026 close of $28.34. Enterprise value adds total debt of $430mn and subtracts cash and equivalents of $2.8bn (net cash of $2.3bn), from the FY2025 balance sheet. Market-derived figures, shown without filing links.
FY2025 at a Glance
Revenue (US$ thousands)
Net income (US$ thousands)
Diluted EPS
Source: FY2025 consolidated statements [1] [2] [3] [4]. Click any linked figure to open the filing page with the row highlighted.
Revenue by Component
| Revenue by Component | FY2021 | FY2022 | FY2023 | FY2024 | FY2025 |
|---|---|---|---|---|---|
| Premium | 1,831,020 | 3,871,117 | 5,686,069 | 8,971,259 | 11,469,893 |
| Investment income | — | 27,594 | 155,447 | 185,729 | 202,941 |
| Other revenues | — | 64,927 | 21,353 | 20,576 | 28,593 |
| Total revenue | 1,838,715 | 3,963,638 | 5,862,869 | 9,177,564 | 11,701,427 |
| Total revenue growth, derived | — | +115.6% | +47.9% | +56.5% | +27.5% |
Source: Consolidated Statements of Operations (FY2025 and FY2024 Forms 10-K); FY2021 premium is the 'Premiums earned' line of the FY2021 Form 10-K, which used the pre-2024 revenue presentation [1] [2] [4]. Click any linked figure to open the filing page with the row highlighted.
Income Statement
Source: Consolidated Statements of Operations. FY2022-FY2024 are cited to the FY2024 Form 10-K, the earliest filing that presents those years in the current revenue and expense format; FY2021 is cited to the FY2021 Form 10-K's original presentation. [1] [2] [3] [4]. Click any linked figure to open the filing page with the row highlighted.
Columns marked E are consensus analyst estimates from S&P Capital IQ (CapIQ), shown alongside reported results for direct comparison; they are not company guidance.
Estimate source: S&P Capital IQ (CapIQ) consensus, as of 2026-07-28. Estimate figures are S&P Capital IQ consensus (vendor data — no filing page links). EPS and net income use the normalized (adjusted) consensus where the street reports it. Line-item analyst models (segments, drivers, KPIs) are in the Visible Alpha tab.
Balance Sheet
Source: Consolidated Balance Sheets. FY2021 is the comparative column of the FY2022 Form 10-K, whose line-item labels match the FY2022 presentation. [5] [6] [7] [8]. Click any linked figure to open the filing page with the row highlighted.
Cash Flow
Source: Consolidated Statements of Cash Flows, each year cited to its own Form 10-K [9] [10] [11] [12]. Click any linked figure to open the filing page with the row highlighted.
Selling, General, and Administrative Expense Detail
| Selling, General, and Administrative Expense Detail | FY2021 | FY2022 | FY2023 | FY2024 | FY2025 |
|---|---|---|---|---|---|
| Member acquisition and servicing costs | — | 679,464 | 540,135 | 747,627 | 975,328 |
| Premium taxes, exchange fees, and other taxes and fees | — | 281,518 | 289,388 | 432,290 | 446,079 |
| All other selling, general, and administrative | — | 296,442 | 596,243 | 575,648 | 628,460 |
| Total selling, general, and administrative expenses | — | 1,257,424 | 1,425,766 | 1,755,565 | 2,049,867 |
Source: Segment Information note (single reportable segment) — significant expense categories reviewed by the chief operating decision maker; first disclosed on adoption of ASU 2023-07 in the FY2024 Form 10-K, so FY2021 is not available [13] [14]. Click any linked figure to open the filing page with the row highlighted.
Membership by Offering and Core States
| Membership by Offering and Core States | FY2021 | FY2022 | FY2023 | FY2024 | FY2025 |
|---|---|---|---|---|---|
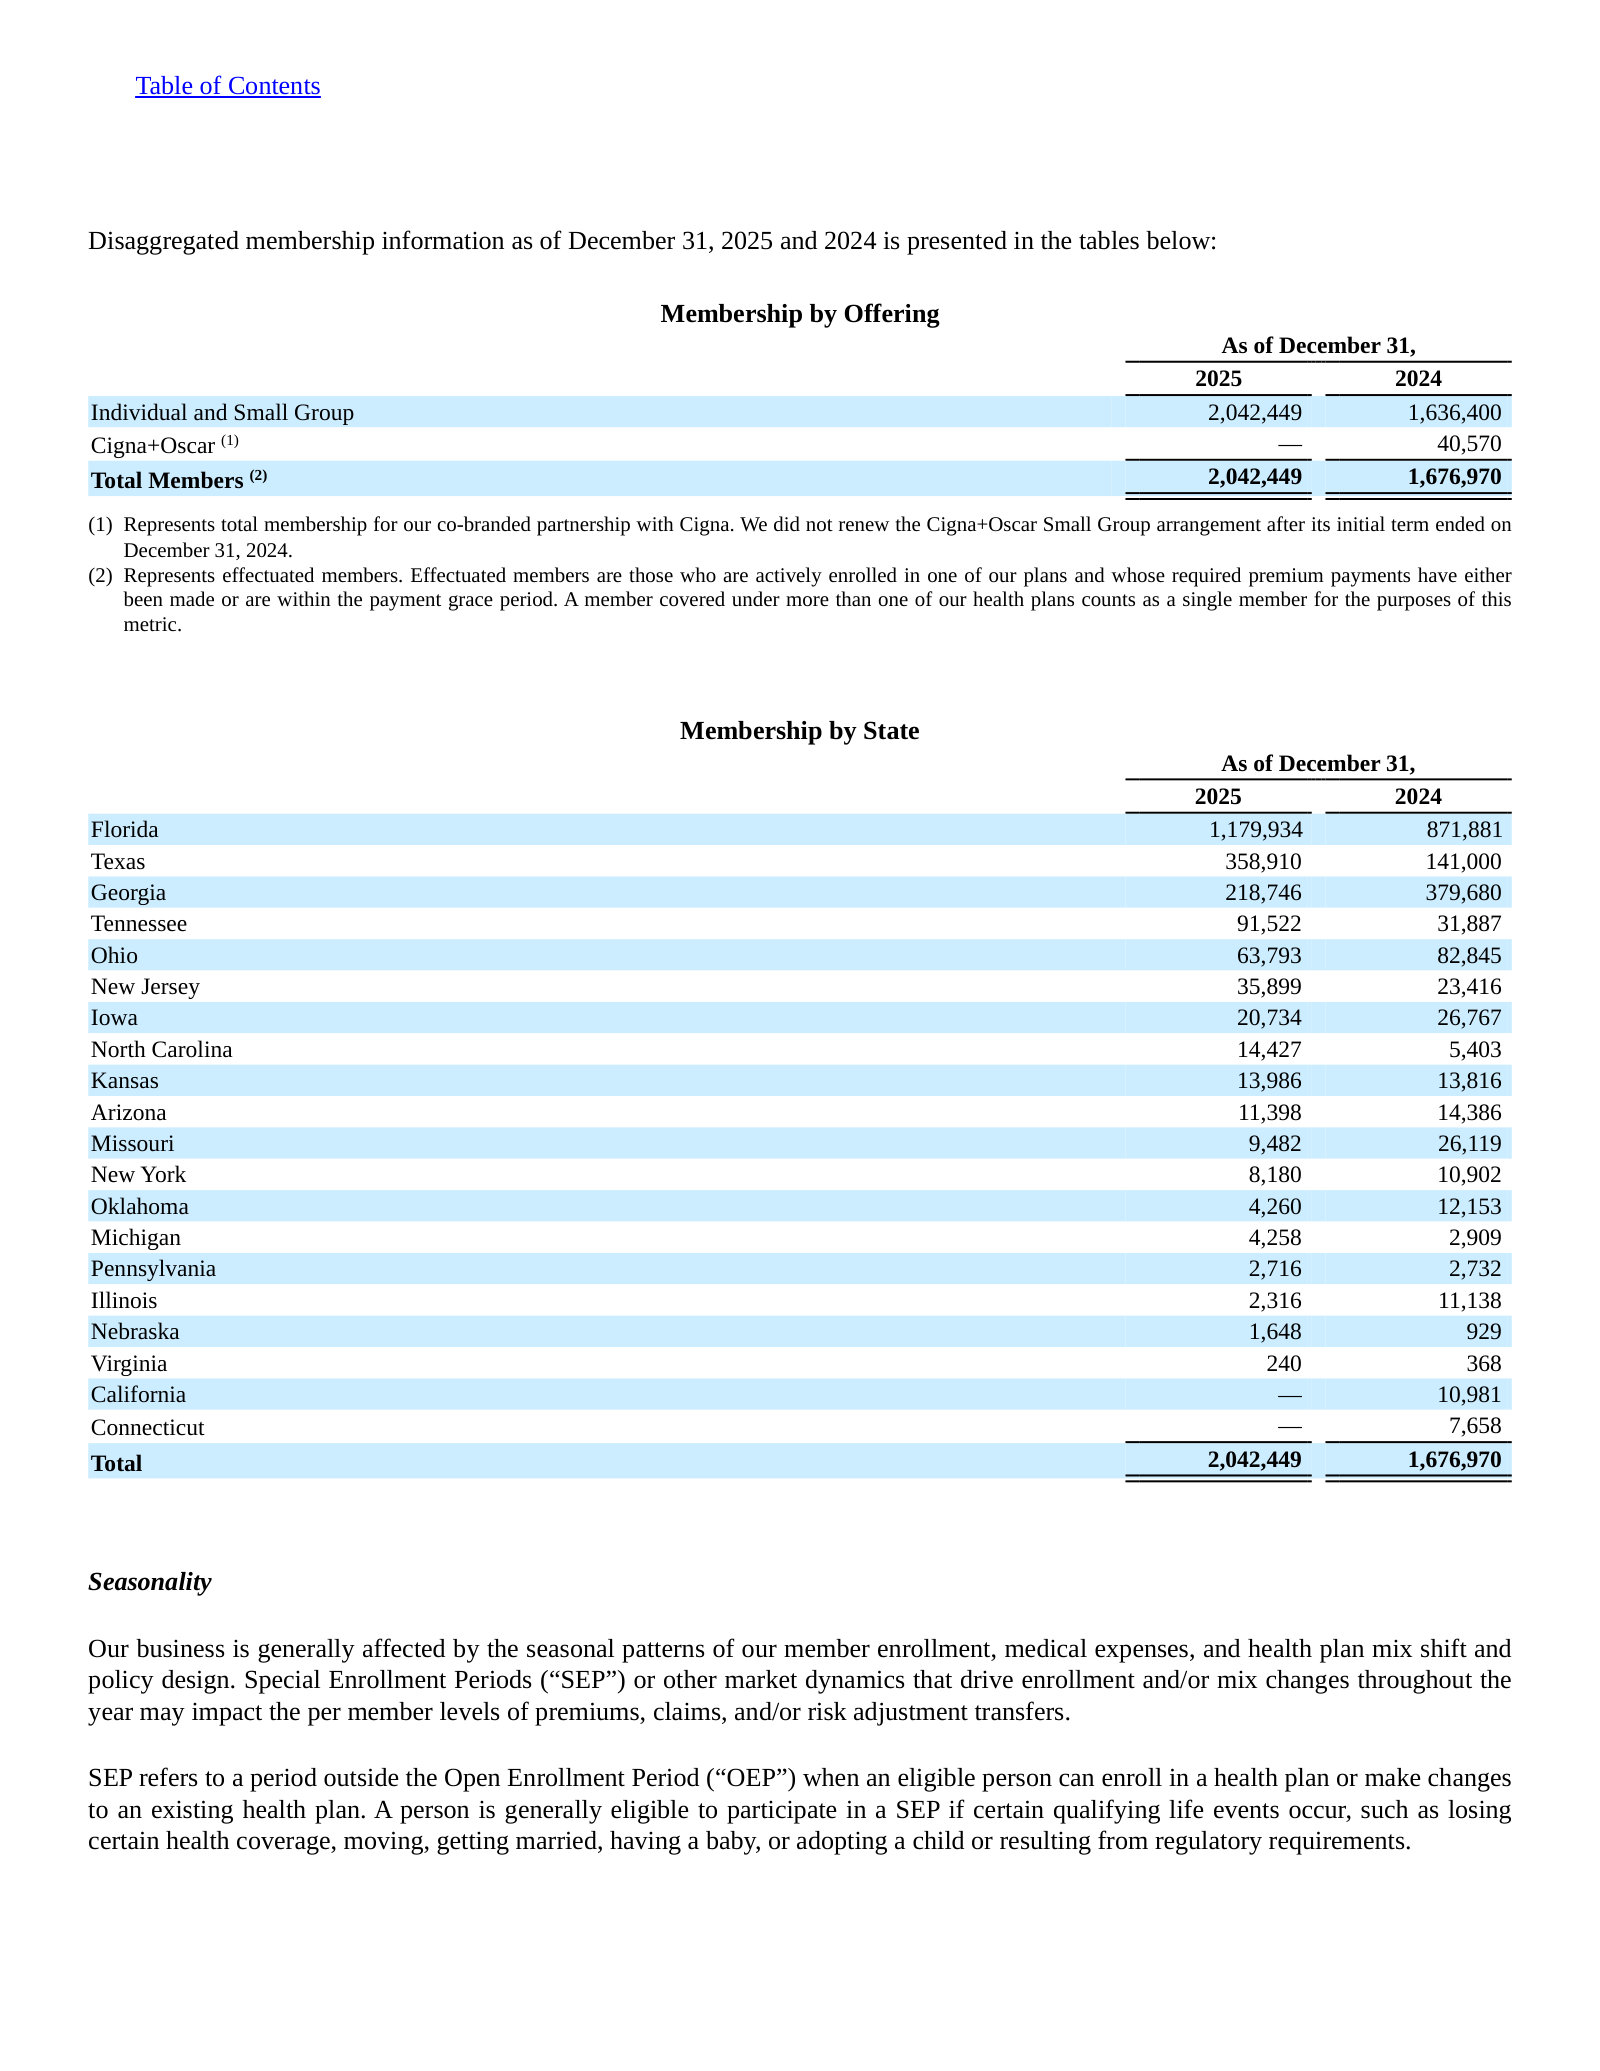
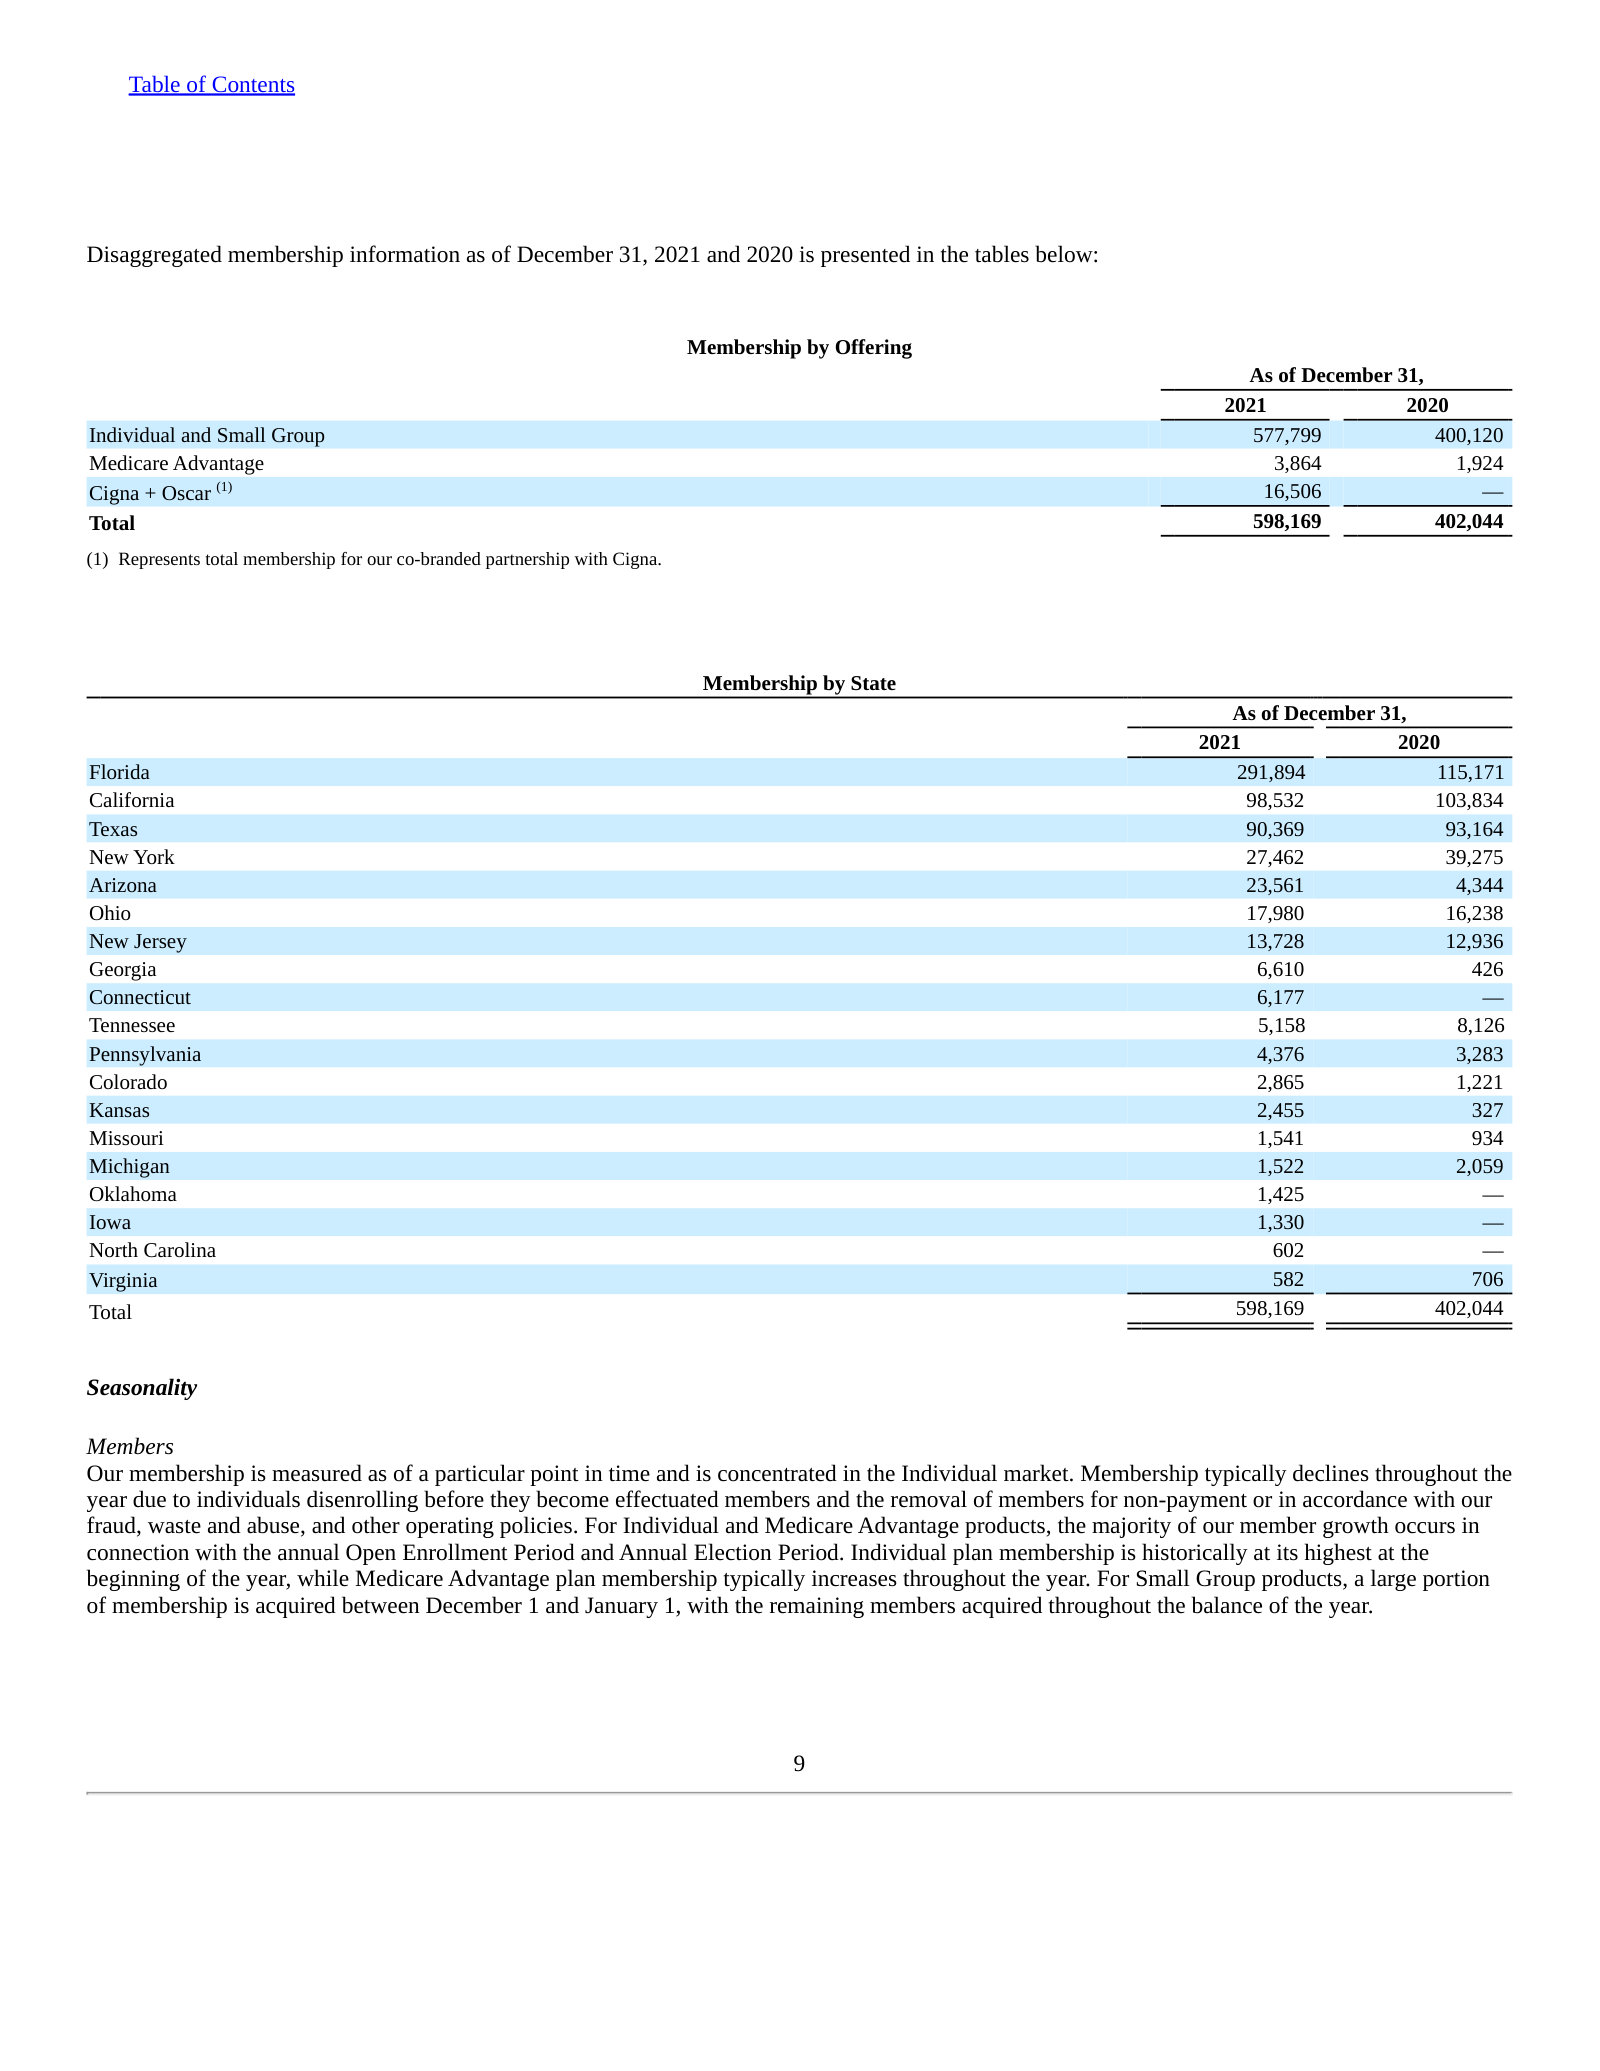
| Individual and Small Group members | 577,799 | 1,084,404 | 967,002 | 1,636,400 | 2,042,449 |
| Cigna+Oscar Small Group members | 16,506 | 62,627 | 67,500 | 40,570 | 0 |
| Medicare Advantage members | 3,864 | 4,452 | 1,781 | 0 | — |
| Members - Florida | 291,894 | 685,205 | 593,867 | 871,881 | 1,179,934 |
| Members - Texas | 90,369 | 148,362 | 112,554 | 141,000 | 358,910 |
| Members - Georgia | 6,610 | 103,970 | 117,189 | 379,680 | 218,746 |
Source: company filings [15] [16] [17] [18]. Click any linked figure to open the filing page with the row highlighted.
InsuranceCo Underwriting and Cost Ratios
| InsuranceCo Underwriting and Cost Ratios | FY2021 | FY2022 | FY2023 | FY2024 | FY2025 |
|---|---|---|---|---|---|
| Direct and Assumed Policy Premiums | 3,436,626 | 6,842,439 | 6,647,658 | — | — |
| Premiums before ceded reinsurance | 2,712,988 | 5,334,520 | 5,696,978 | — | — |
| InsuranceCo Administrative Expense Ratio | 21.8% | 20.6% | 17.9% | — | — |
| InsuranceCo Combined Ratio | 110.7% | 105.8% | 99.5% | — | — |
| Adjusted Administrative Expense Ratio | 28.9% | 24.6% | 21.0% | — | — |
| SG A Expense Ratio | — | 31.7% | 24.3% | 19.1% | 17.5% |
| Adjusted EBITDA | (429,826) | (462,255) | (45,238) | 199,234 | (279,811) |
Source: company filings [19] [20] [21] [22]. Click any linked figure to open the filing page with the row highlighted.
Premium Mix and Subsidy Dependence
| Premium Mix and Subsidy Dependence | FY2021 | FY2022 | FY2023 | FY2024 | FY2025 |
|---|---|---|---|---|---|
| Policy premiums collected from CMS (APTC) | 2,500,000 | 5,700,000 | 5,500,000 | 9,512,300 | — |
| Policy premiums collected from members | 911,600 | 977,000 | 900,000 | 799,300 | — |
| Assumed policy premiums (Cigna+Oscar) | 16,300 | 138,100 | 228,800 | — | — |
| Reinsurance premiums ceded | (881,968) | (1,463,403) | (10,909) | — | — |
| Direct policy premiums subsidized by APTCs | — | 85.0% | 85.0% | 92.0% | 97.0% |
| Revenue from ACA-regulated health plans | 98.0% | 99.0% | 97.0% | 97.0% | 98.0% |
Source: company filings [23] [24] [25] [26]. Click any linked figure to open the filing page with the row highlighted.
Statutory Capital and Parent Liquidity
| Statutory Capital and Parent Liquidity | FY2021 | FY2022 | FY2023 | FY2024 | FY2025 |
|---|---|---|---|---|---|
| Combined statutory capital and surplus | 474,800 | 701,500 | 800,600 | 1,242,700 | 1,000,000 |
| Excess over minimum statutory RBC requirement | — | 198,000 | 301,000 | 734,000 | 315,000 |
| Additional capital required absent quota share reinsurance | 147,900 | 446,800 | 447,100 | 553,800 | 683,100 |
| Capital contributions from Parent to insurance subsidiaries | 540,900 | 423,500 | 19,500 | 146,600 | 120,800 |
| Cash and investments held at Parent / holding company | 738,600 | 342,000 | 233,500 | 189,800 | 414,200 |
| Cash and investments held at Health Insurance Subsidiaries | — | 2,900,000 | 2,721,200 | 3,808,000 | 5,100,000 |
Source: company filings [27] [28] [29] [30]. Click any linked figure to open the filing page with the row highlighted.
Long-Term Record
| Fiscal year | Total revenue | Earnings (loss) from operations | Net income (loss) attributable to Oscar Health, Inc. | Diluted earnings (loss) per share | Net cash provided by (used in) operating activities | Purchase of property, equipment and capitalized software | Total stockholders' equity |
|---|---|---|---|---|---|---|---|
| FY2019 | 488,188 | (259,389) | (261,182) | (9.06) | (165,370) | (25,996) | (945,138) |
| FY2020 | 462,801 | (402,266) | (406,825) | (14.16) | 222,732 | (14,021) | (1,295,893) |
| FY2021 | 1,838,715 | (544,481) | (572,606) | (3.20) | (181,745) | (25,885) | 1,392,522 |
| FY2022 | 3,963,638 | (589,867) | (606,275) | (2.85) | 380,349 | (29,012) | 892,400 |
| FY2023 | 5,862,869 | (235,615) | (270,728) | (1.22) | (272,159) | (25,577) | 806,117 |
| FY2024 | 9,177,564 | 57,265 | 25,432 | 0.10 | 978,193 | (27,897) | 1,016,425 |
| FY2025 | 11,701,427 | (396,357) | (443,151) | (1.69) | 1,094,854 | (36,372) | 980,735 |
Source: consolidated statements across filings; older years from the standardized feed [31] [9] [5] [1]. Click any linked figure to open the filing page with the row highlighted.
Operating KPIs
| KPI | FY2021 | FY2022 | FY2023 | FY2024 | FY2025 |
|---|---|---|---|---|---|
| Total members | 598,169 | 1,151,483 | 1,036,283 | 1,676,970 | 2,042,449 |
| Medical Loss Ratio | 88.9% | 85.3% | 81.6% | 81.7% | 87.4% |
Source: company-reported operating metrics [32] [15] [33] [16]. Click any linked figure to open the filing page with the row highlighted.
Analyst Consensus
Mean target
Median target
High target
Low target
Street ratings: 3 buy, 7 hold, 1 sell. Consensus: Hold.
Estimate source: S&P Capital IQ (CapIQ) consensus, as of 2026-07-28. Estimate figures are S&P Capital IQ consensus (vendor data — no filing page links). EPS and net income use the normalized (adjusted) consensus where the street reports it. Line-item analyst models (segments, drivers, KPIs) are in the Visible Alpha tab.
Traceability
526 of 526 figures on this page (100%) link to the filing page where they are printed — click a linked figure to open the source PDF at that page with the row highlighted. Unlinked figures come from standardized data feeds or pre-filing years.
All figures are in US$ thousands, the scale Oscar Health prints on every statement page ('(in thousands, except per share amounts)'). Per-share rows are in dollars and Medical Loss Ratio is a percentage.
Oscar reports as a single reportable segment, so the revenue breakdown is the Company's own revenue disaggregation from the Consolidated Statements of Operations (Premium, Investment income, Other revenues) rather than a segment cut.
Presentation change: the FY2024 Form 10-K recast the income statement into Premium / Investment income / Services and other revenue and Medical / Selling, general, and administrative / Depreciation and amortization expense. FY2022-FY2024 are therefore cited to the FY2024 Form 10-K, the earliest filing in the corpus that prints those years in the current format. FY2021 is cited to the FY2021 Form 10-K's original presentation, in which Premium appears as 'Premiums earned' and Medical as 'Claims incurred, net'.
FY2021 Investment income, Other revenues and Selling, general, and administrative are shown as not available: the FY2021 presentation combined investment income with other revenue and split operating costs into Other insurance costs, General and administrative expenses, Federal and state assessments and Premium deficiency reserve, and no filing in the corpus recasts FY2021 into the current format.
FY2021 Depreciation and amortization is cited to the FY2021 Form 10-K Consolidated Statements of Cash Flows, the only place that year's figure is printed as a discrete line.
FY2021 balance sheet figures are the December 31, 2021 comparative column of the FY2022 Form 10-K, whose line-item labels match the current presentation.
The Selling, General, and Administrative Expense Detail comes from the Segment Information note, first disclosed on adoption of ASU 2023-07 in the FY2024 Form 10-K (FY2022-FY2024) and updated in the FY2025 Form 10-K (FY2025). FY2021 is not disclosed.
Medical Loss Ratio for FY2021-FY2023 is the ratio printed in each year's Form 10-K Item 1 key-metrics table; FY2024 and FY2025 are the ratio printed in the MD A reconciliation of net claims to net premiums before ceded quota share reinsurance. The FY2024 Form 10-K restates FY2023 on the later basis at 81.6 percent, the same figure the FY2023 Form 10-K printed.
FY2019 and FY2020 in the Long-Term Record are the comparative columns of the FY2021 Form 10-K, which restates per-share amounts for the pre-IPO recapitalization. FY2019 total stockholders' equity is the stockholders' deficit printed in the March 2021 IPO prospectus (Form 424B4) and excludes US$1,295,744k of convertible preferred stock that sat outside permanent equity until the IPO.
The Total stockholders' equity row includes noncontrolling interests, as printed. The provider feed reports the Total Oscar Health, Inc. stockholders' equity line instead (US$977,648k vs US$980,735k at FY2025).
Quarterly cash flows are derived from the printed year-to-date statements: Q1 FY25 and Q1 FY26 are the printed three-month columns, and every other quarter is the exact difference of two printed year-to-date figures. Each derived value was reconciled against the provider's quarterly cash-flow feed, which agrees to the dollar.
Q4 FY24 and Q4 FY25 income-statement figures are the printed three-month December-quarter columns of the Q4 earnings releases (Form 8-K Exhibit 99.1); the corresponding balance sheets are the December 31 columns of the Forms 10-K.
Beginning with the Q1 2026 Form 10-Q, risk adjustment transfer receivable and payable were reclassified into Receivables from CMS and Payables to CMS. Annual balance sheet rows use the presentation as filed in each Form 10-K.
2 figure(s) differed between the data feed and the filing; the filing value is shown (see the run's metrics/metrics_tab.json for the audit trail).
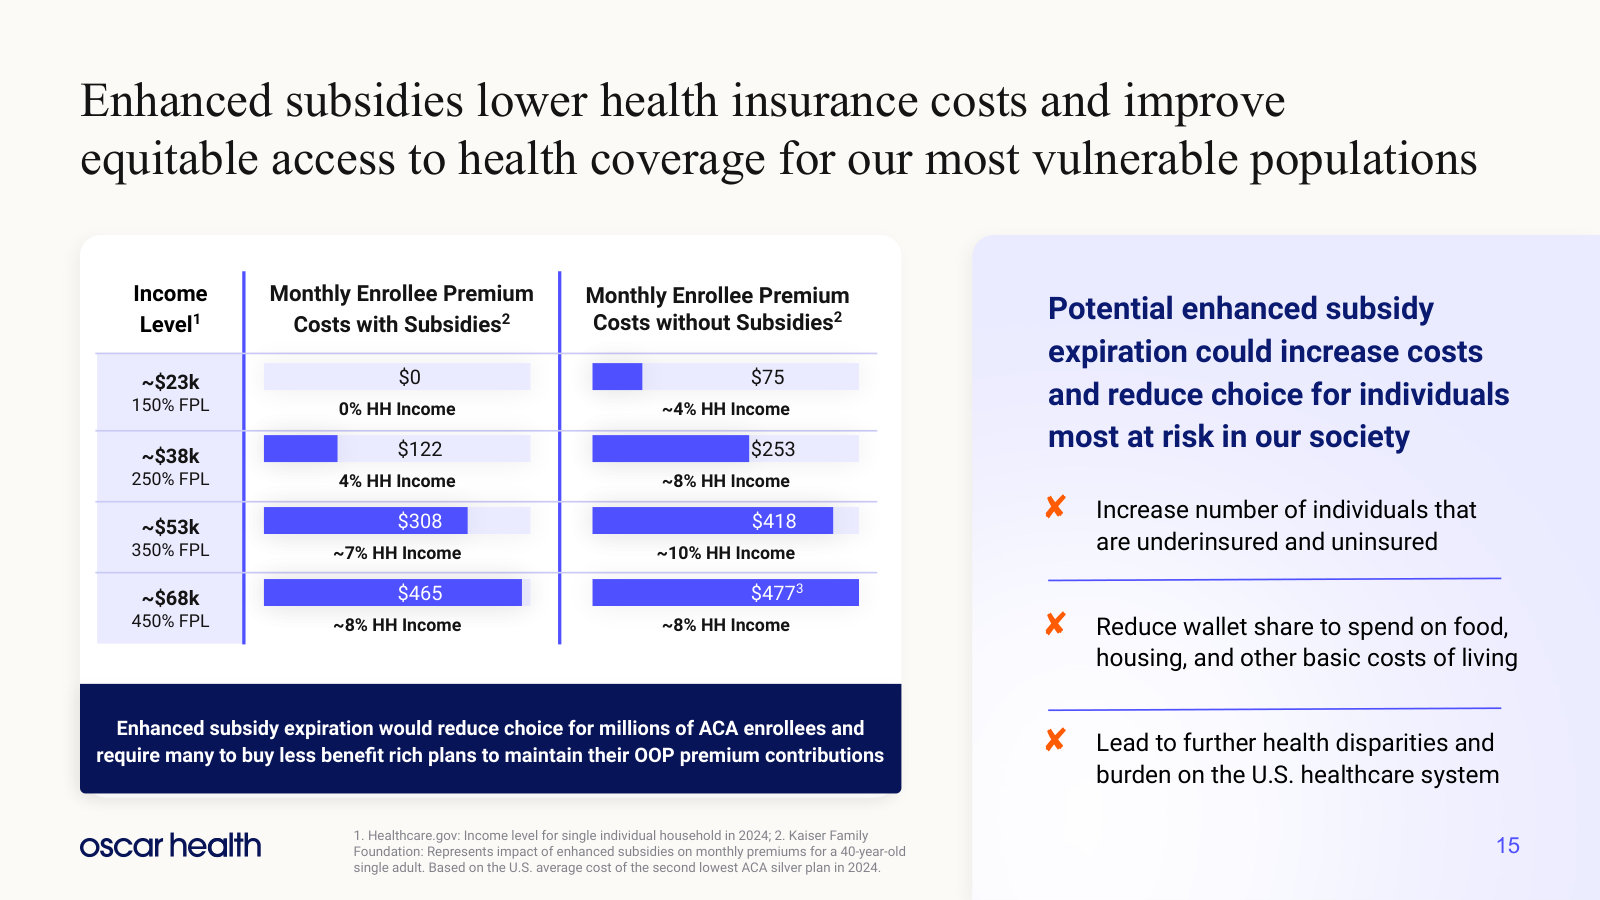
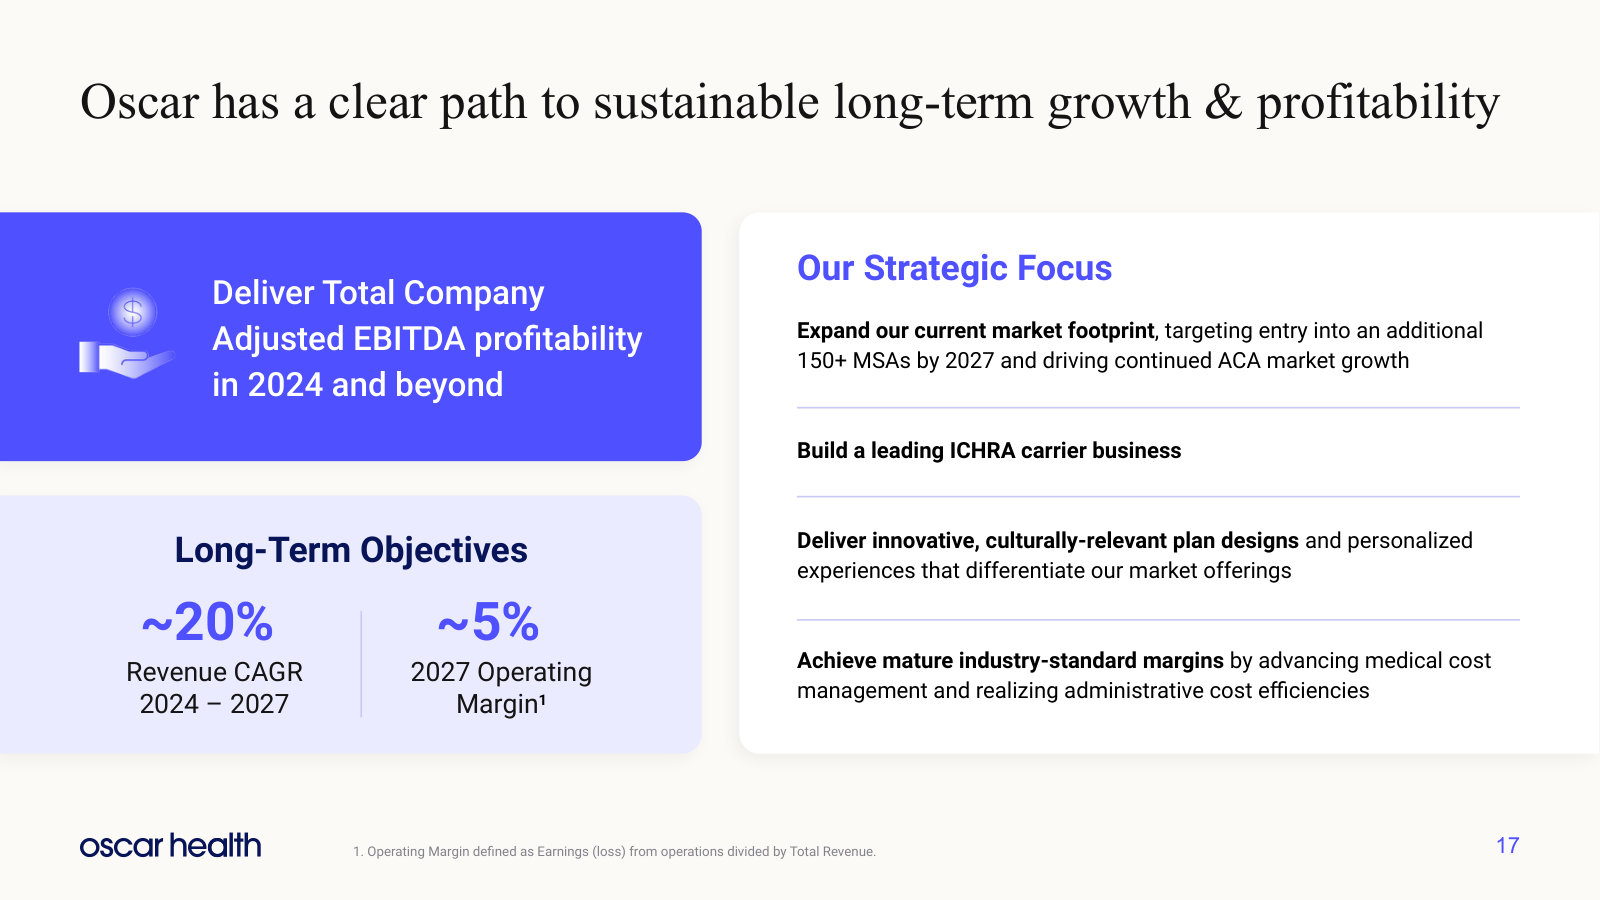
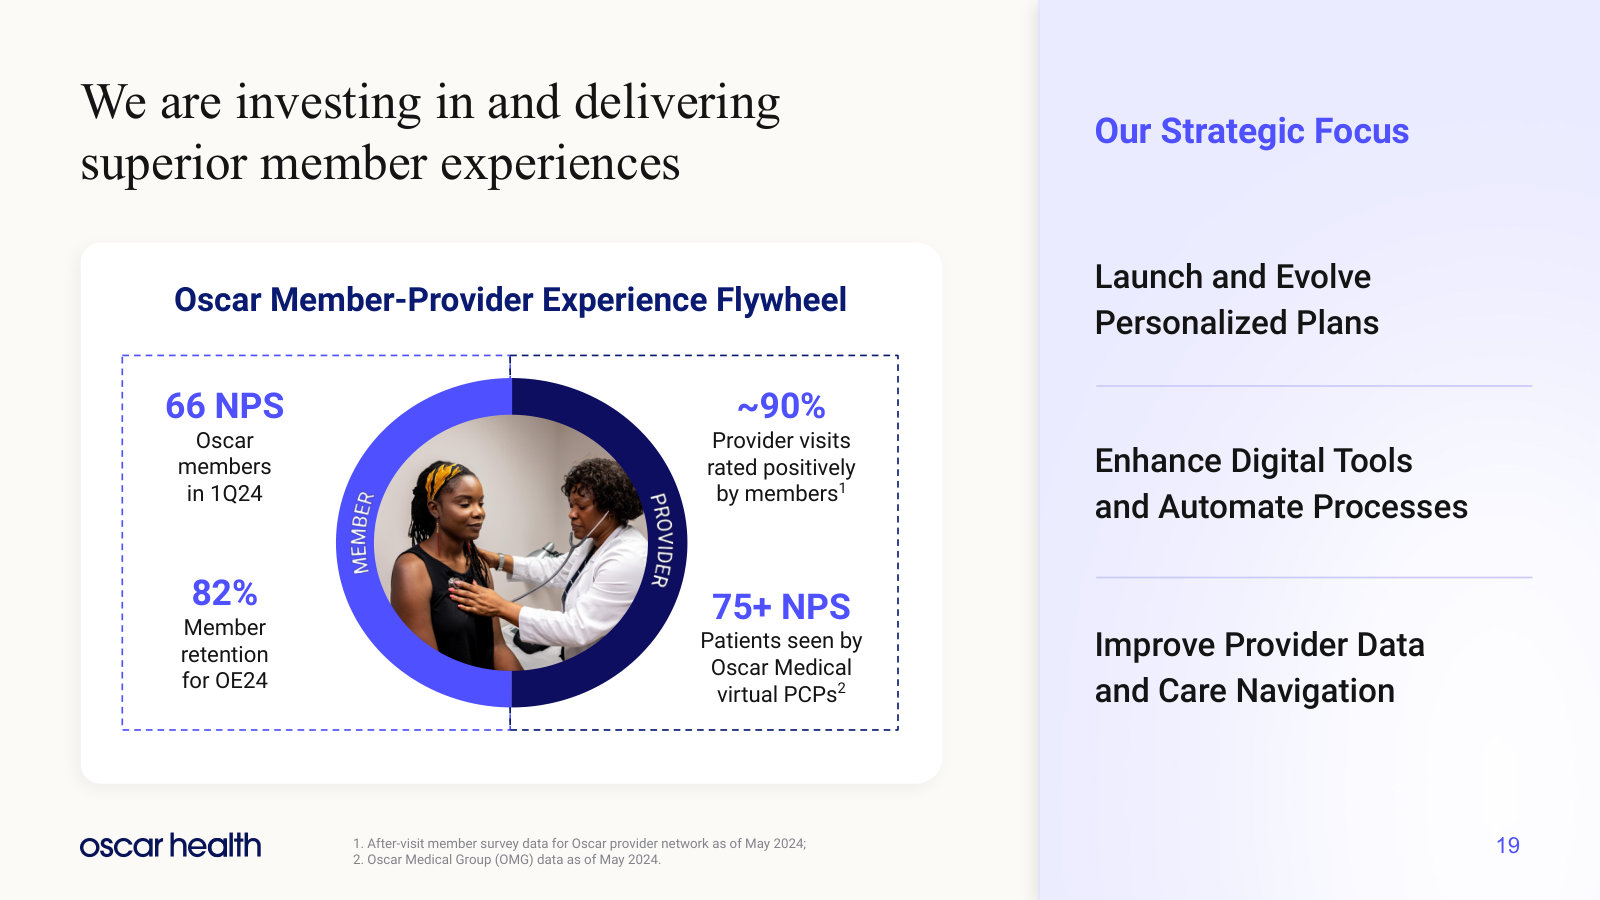
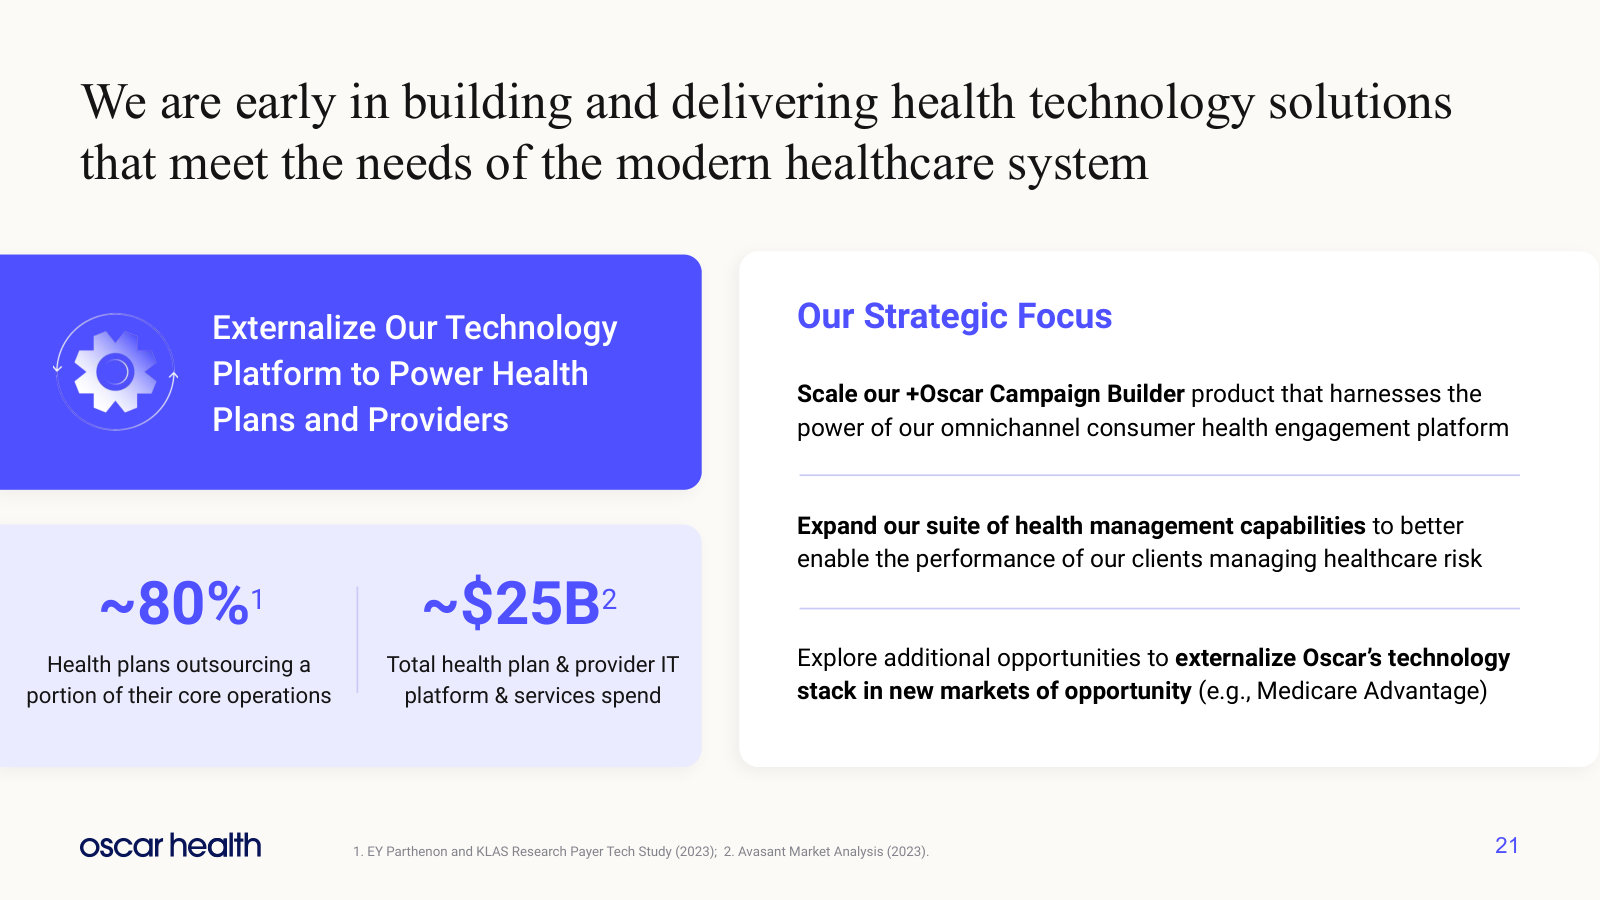
Oscar Health, Inc.'s management explains the business in its own materials. The slides below do the most of that work, pulled from the documents preserved in Sources. Each source link opens the complete presentation at that slide in a new tab.
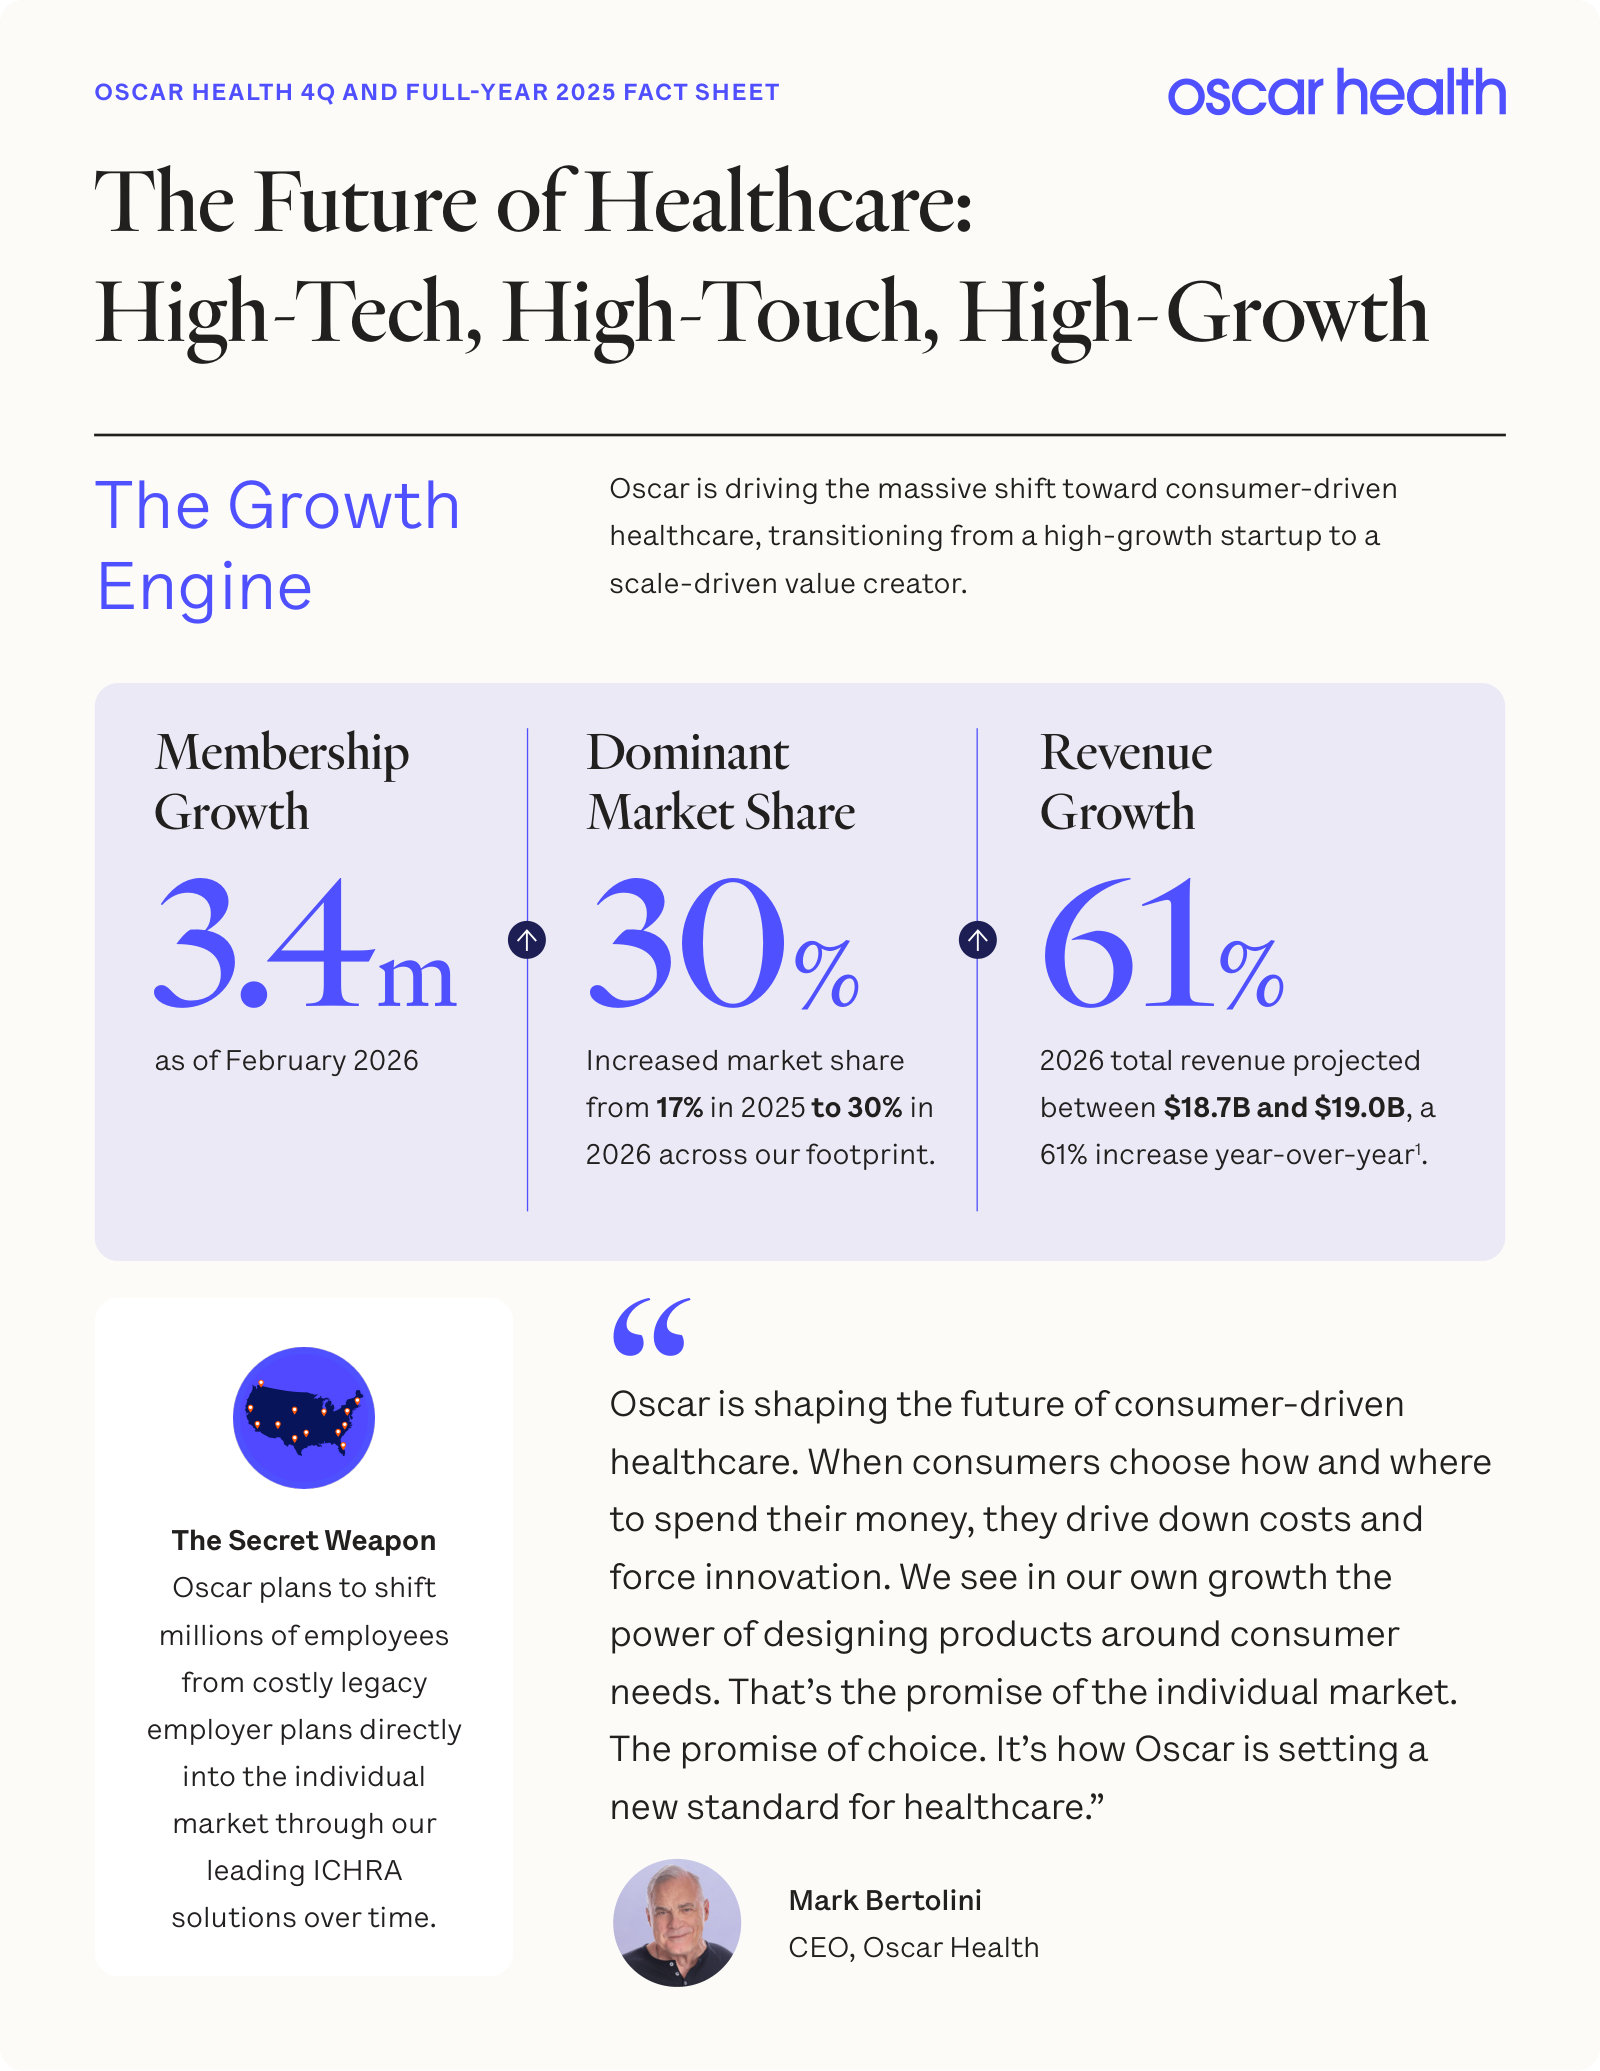
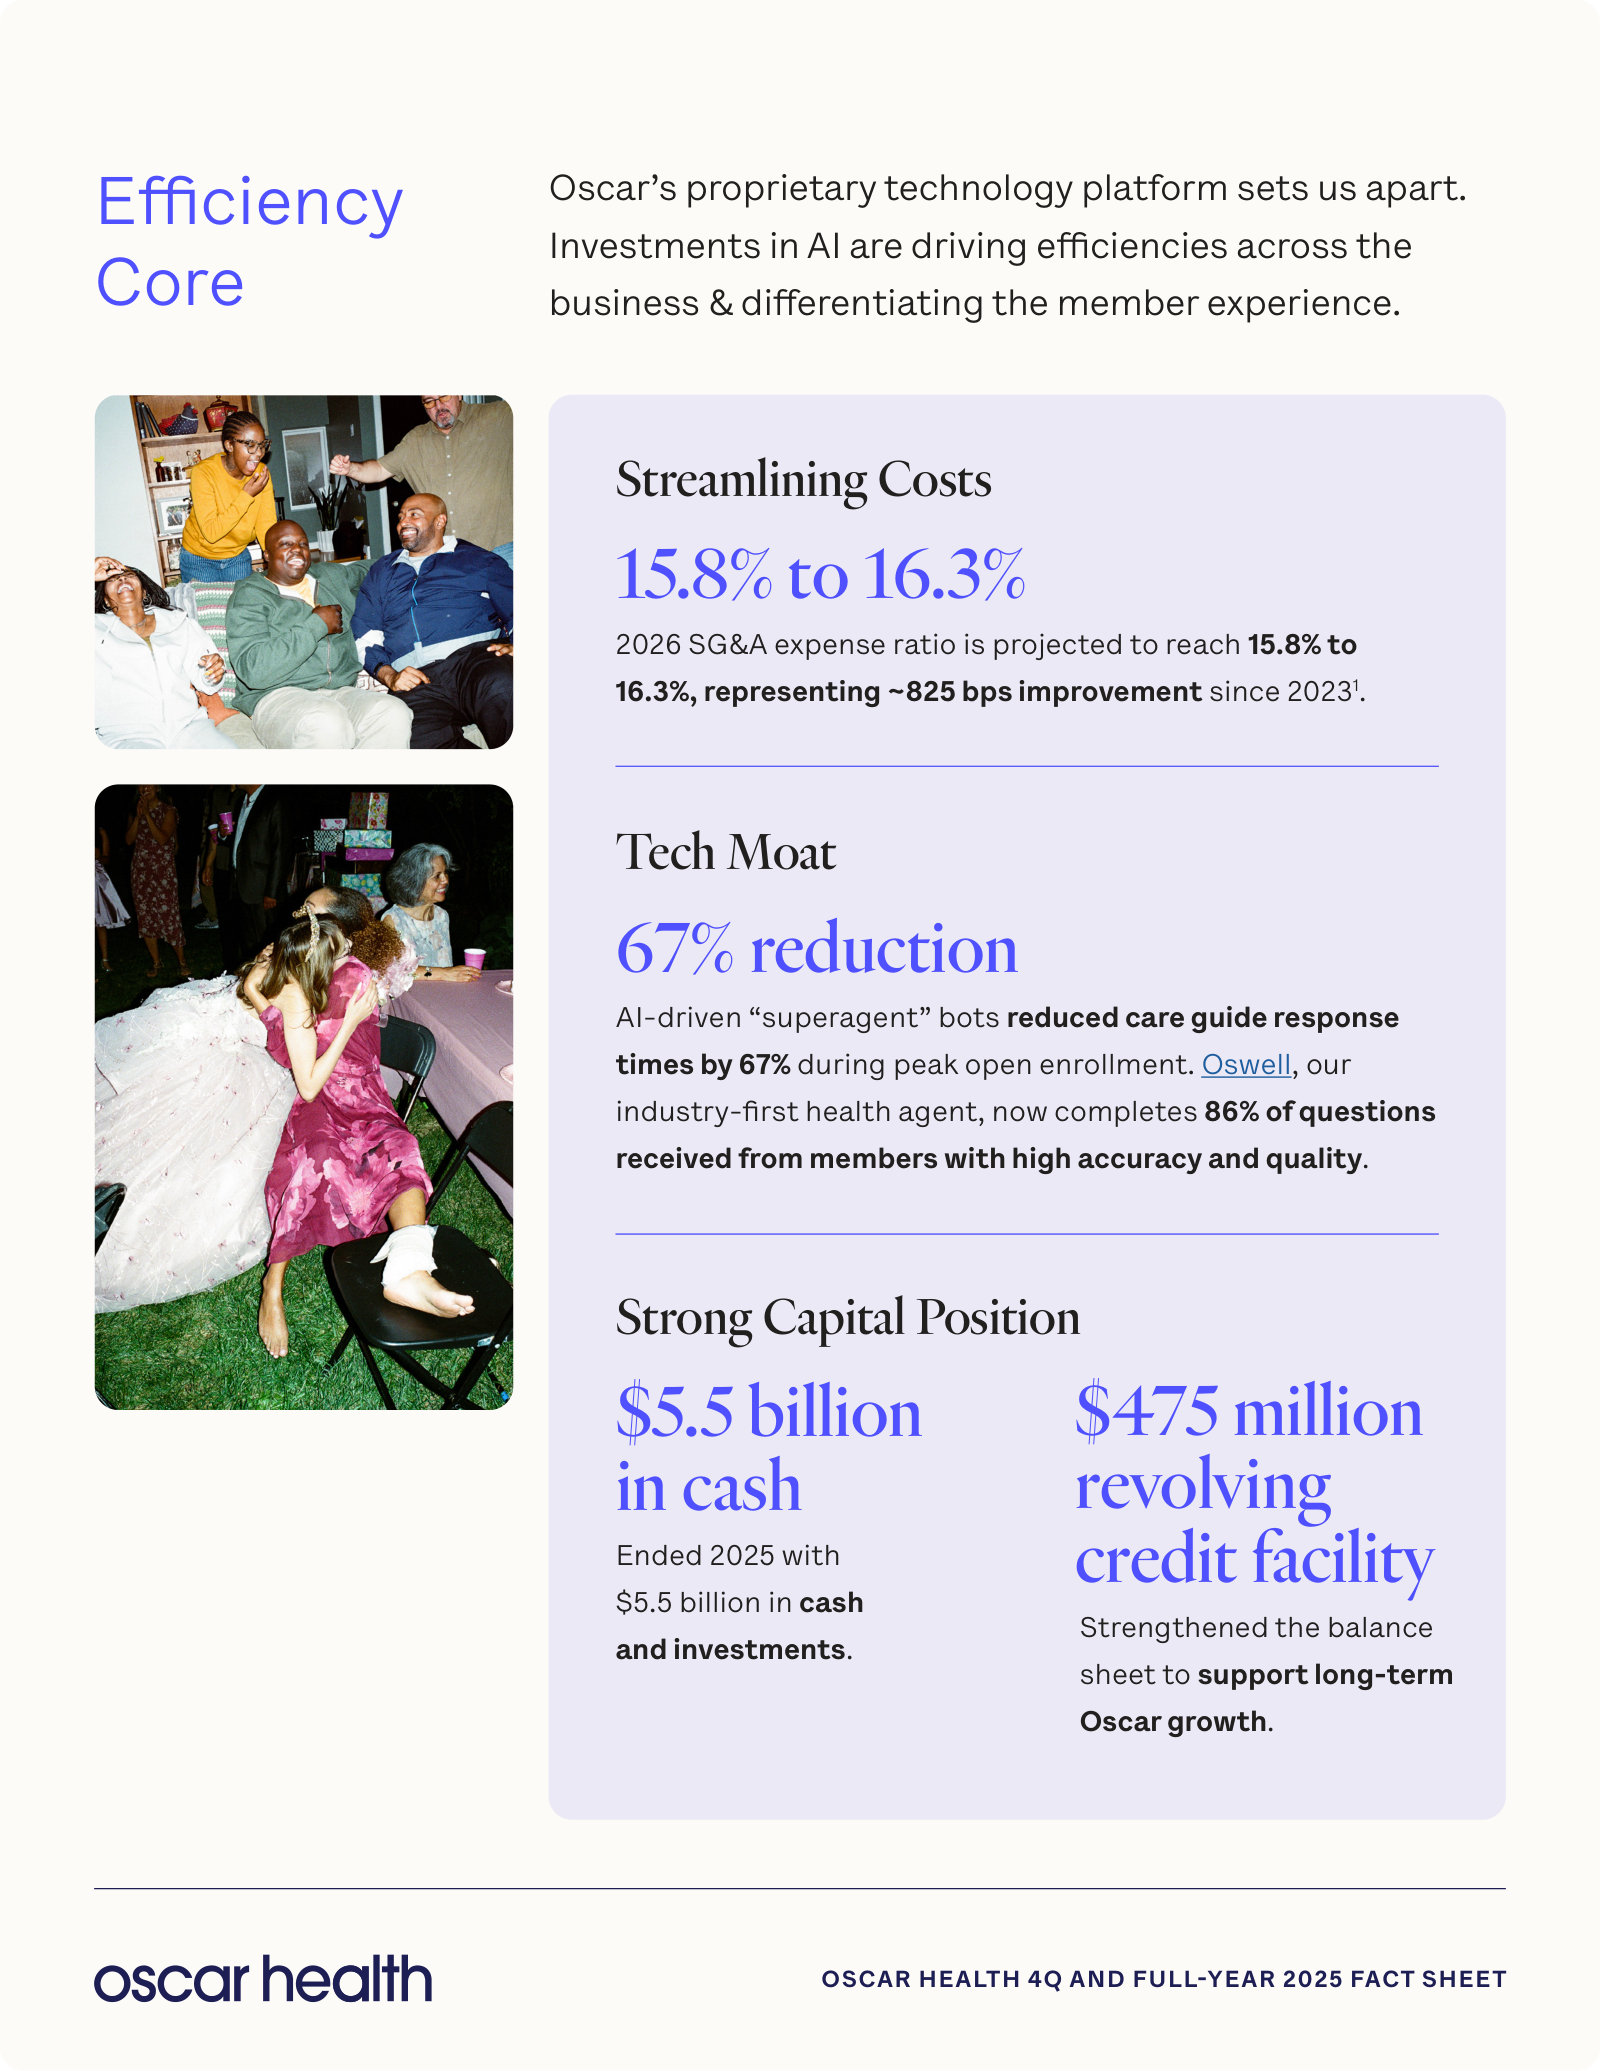
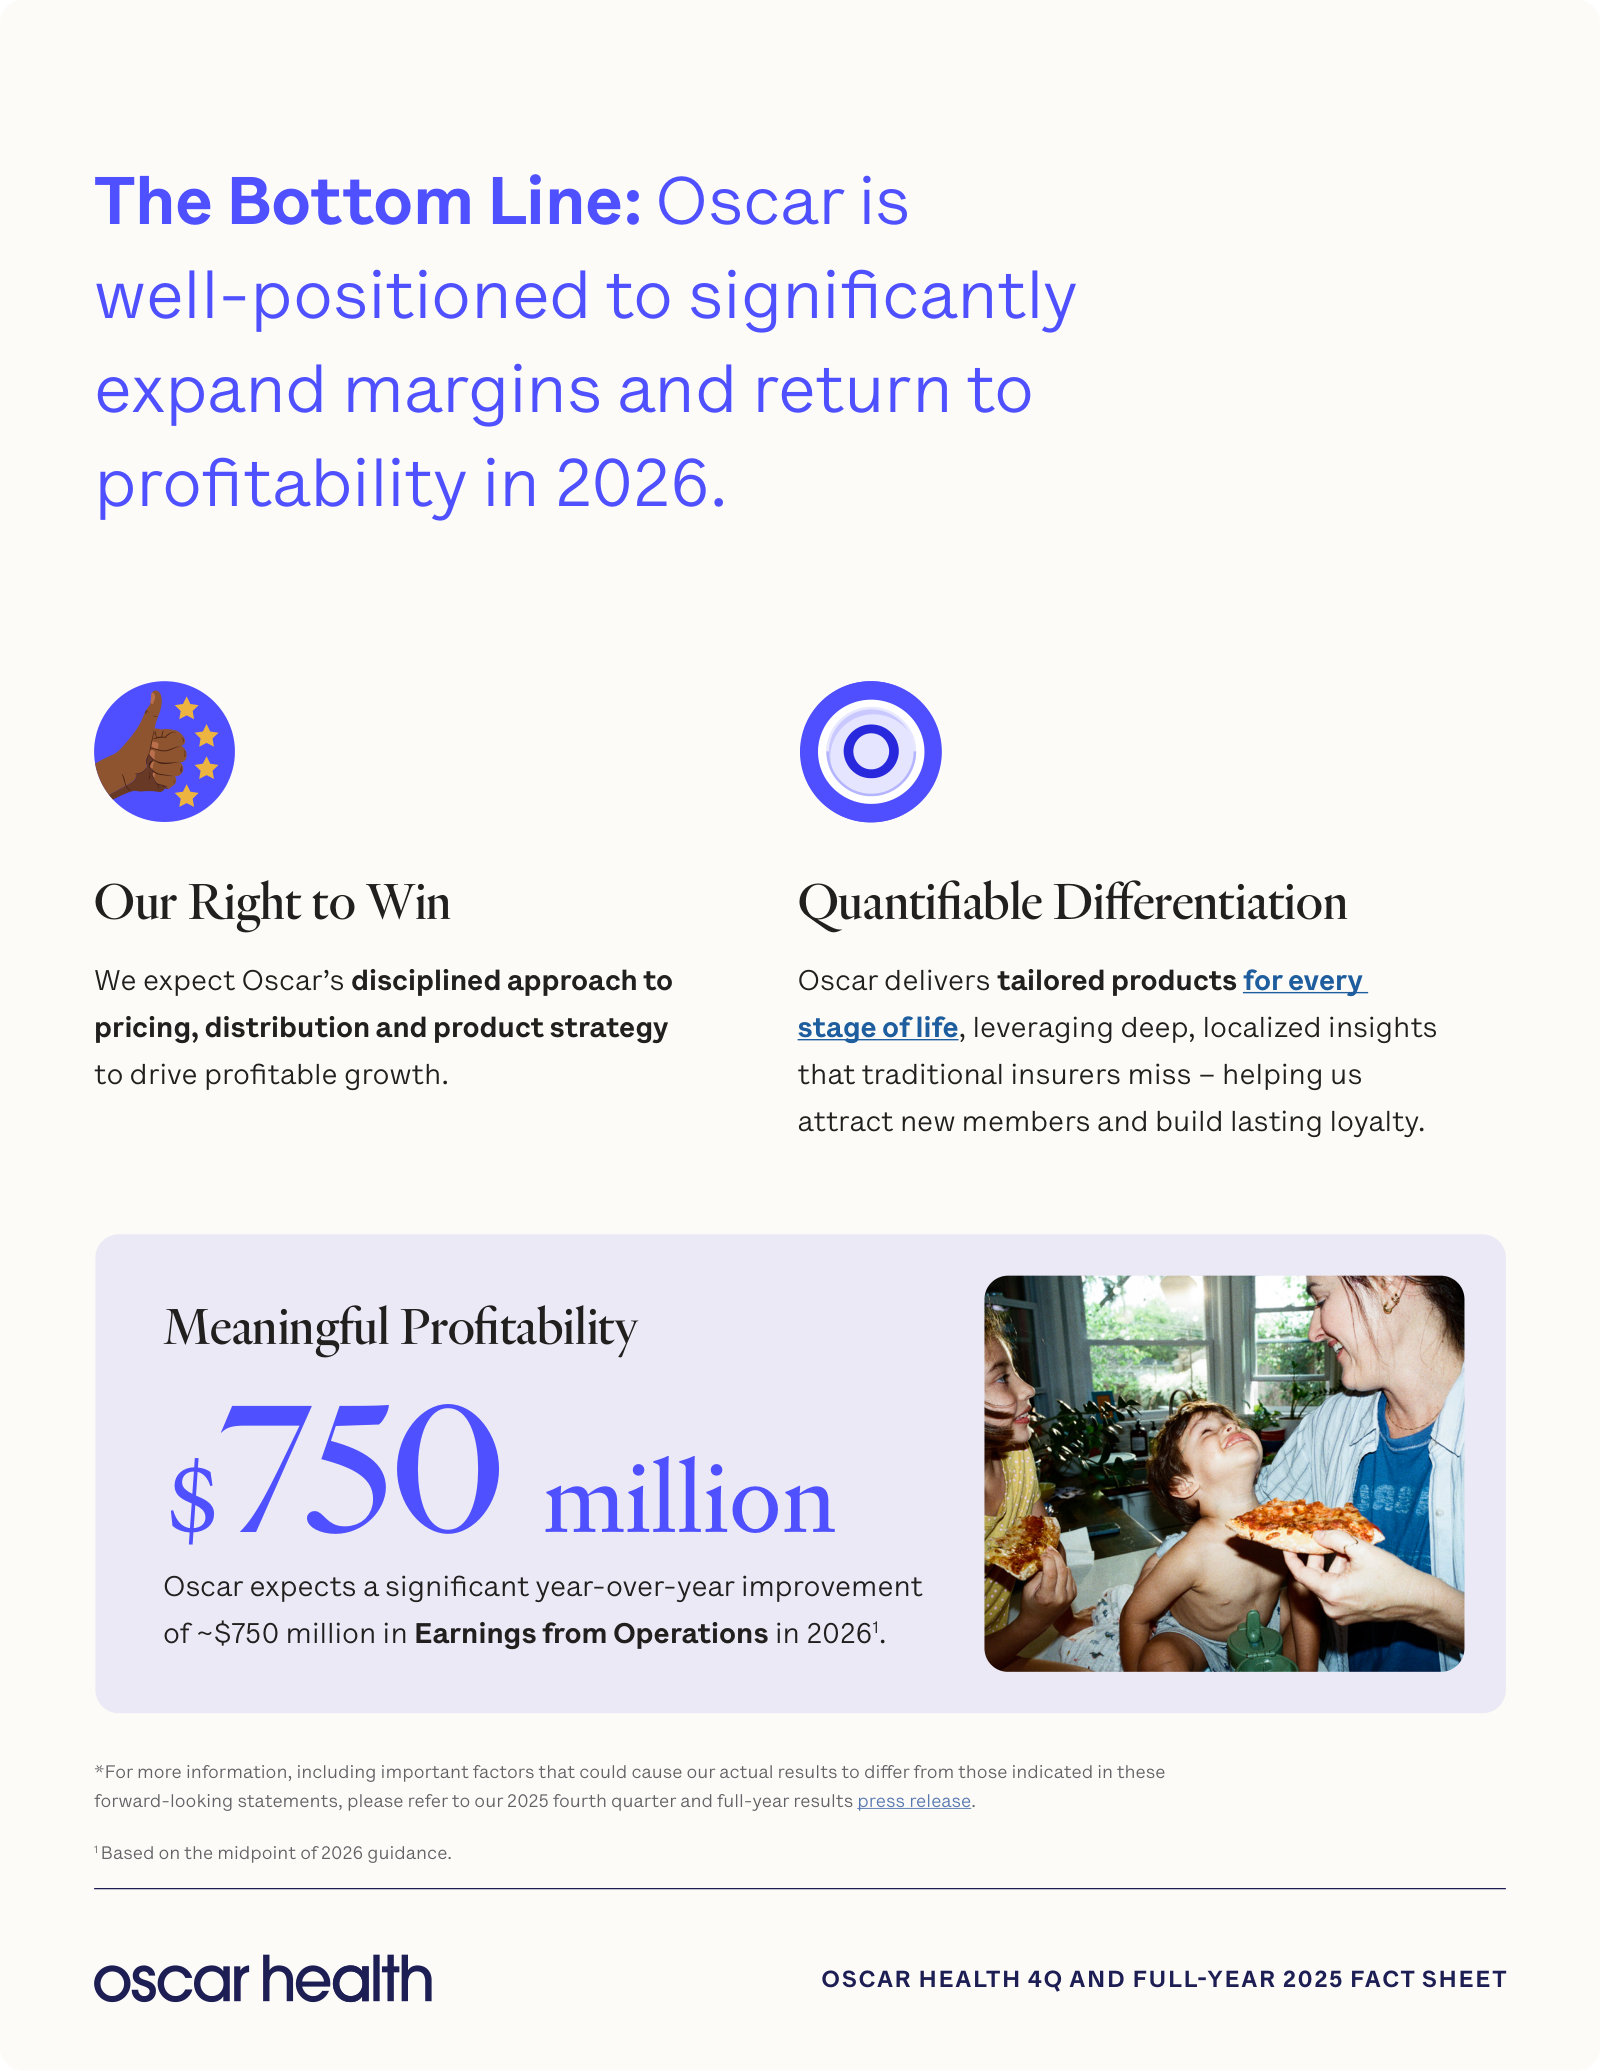
4Q and Full-Year 2025 Fact Sheet — FY2025
A three-page fact sheet issued with 4Q25 results — current scale, 2026 guidance and the margin story in management's own framing. · Open the full document →
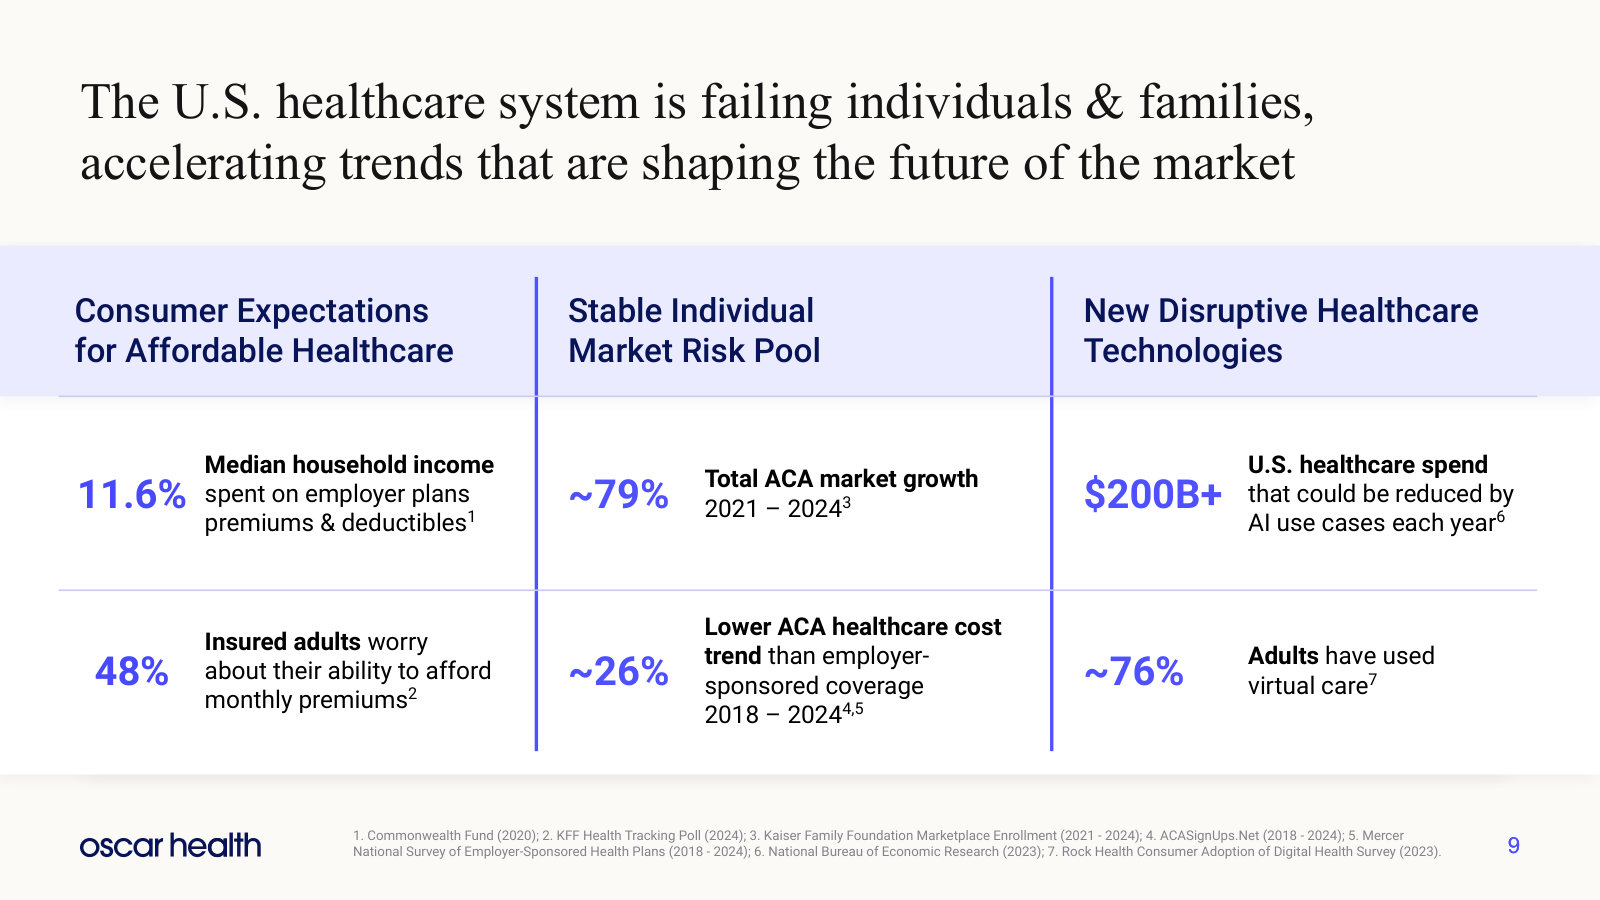
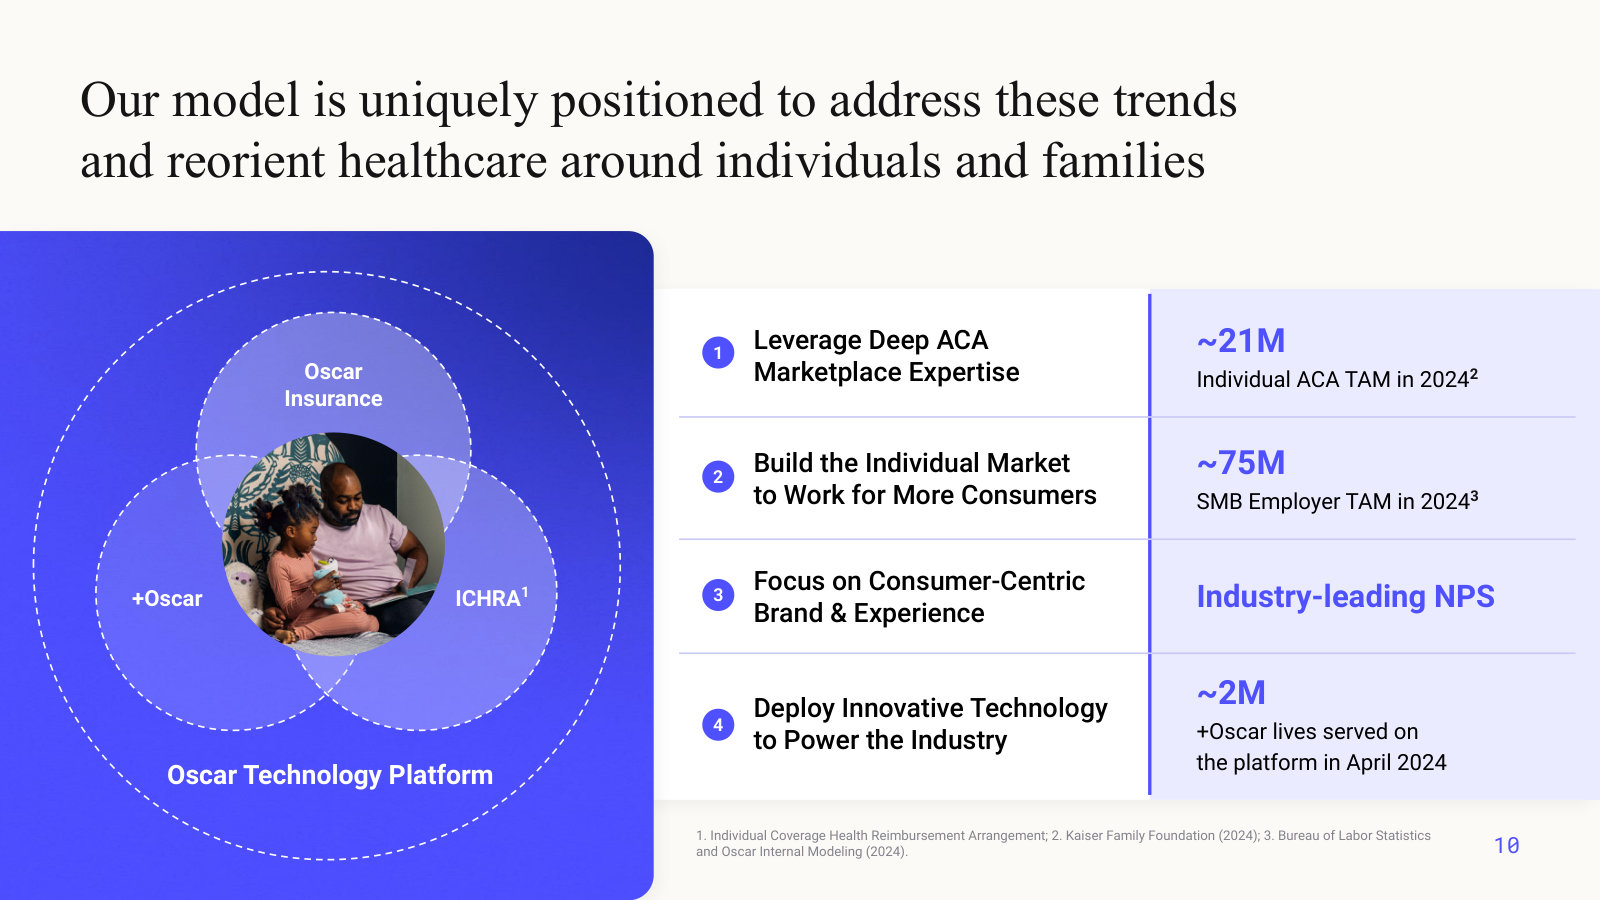
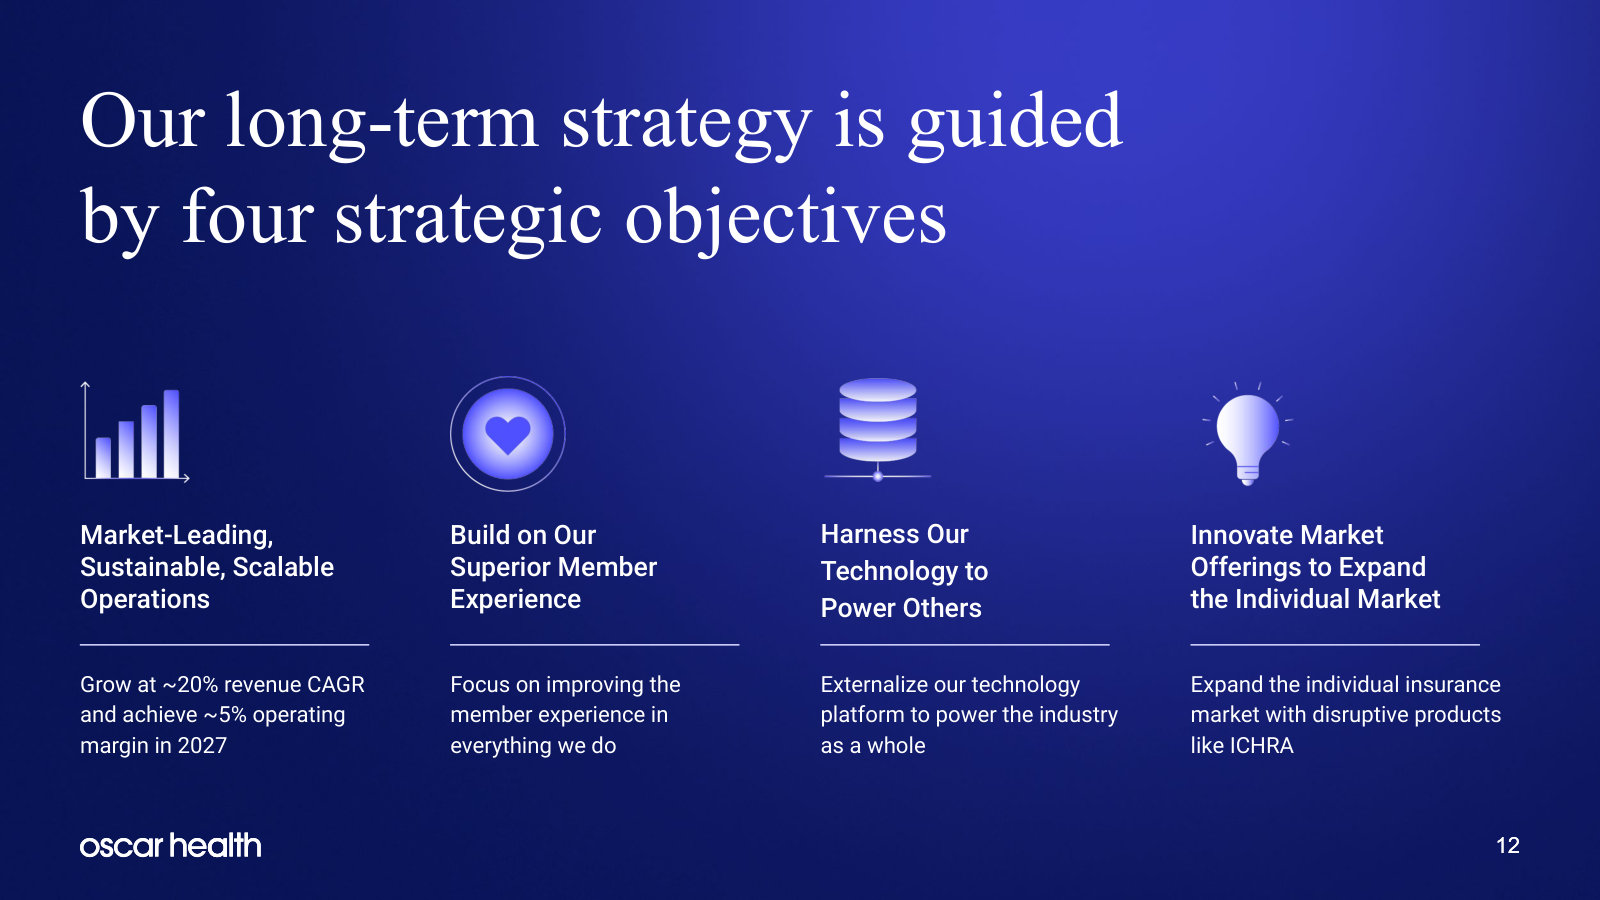
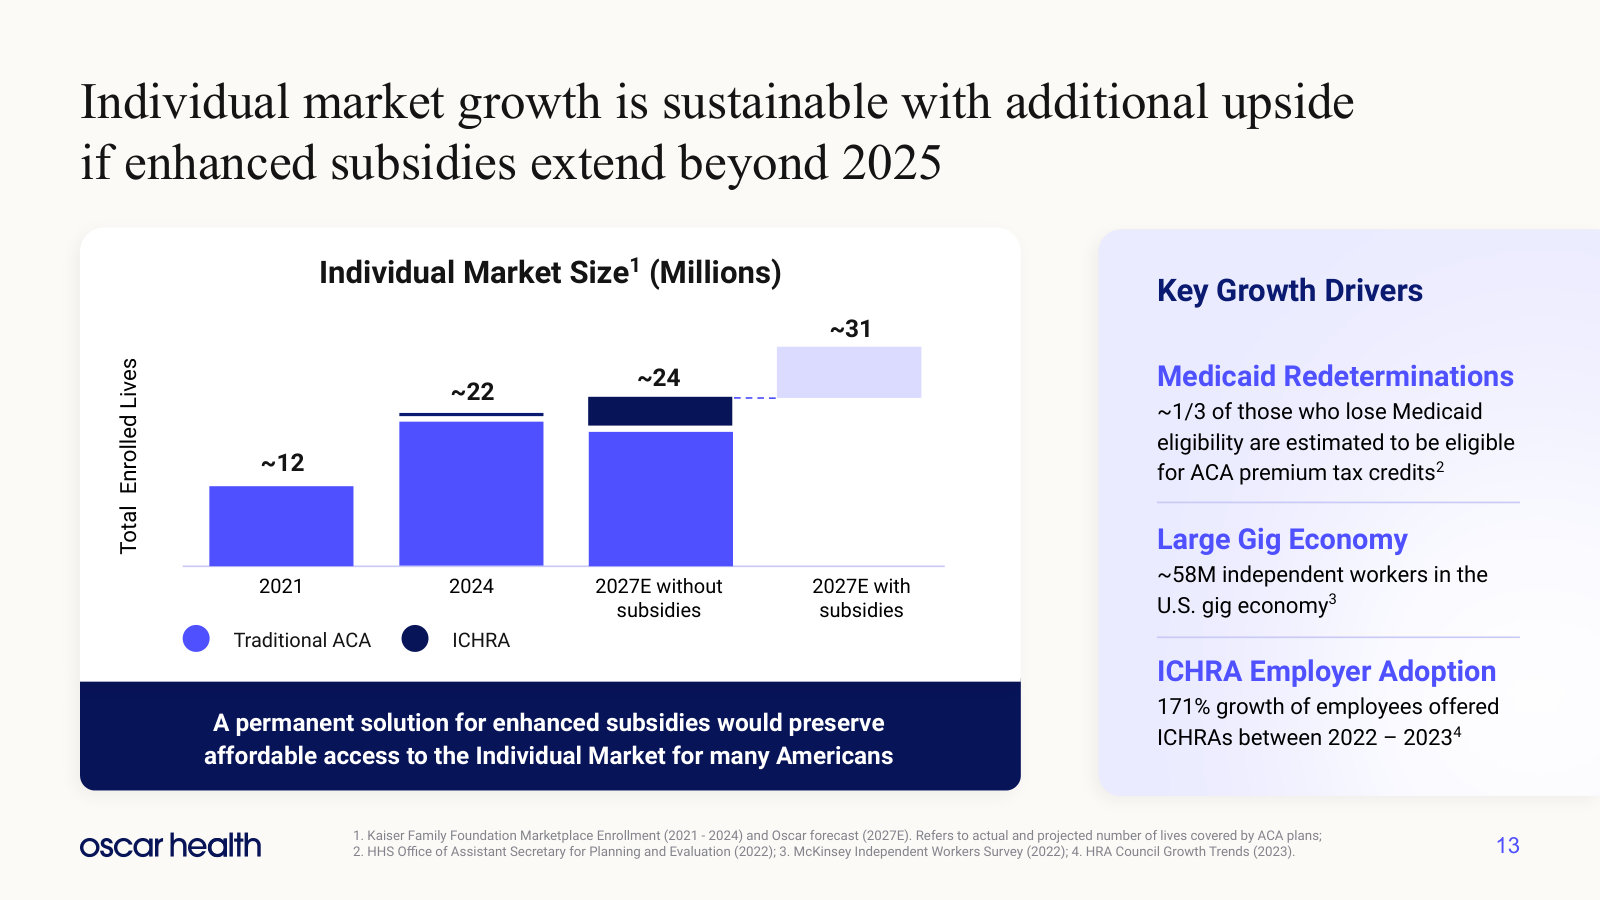
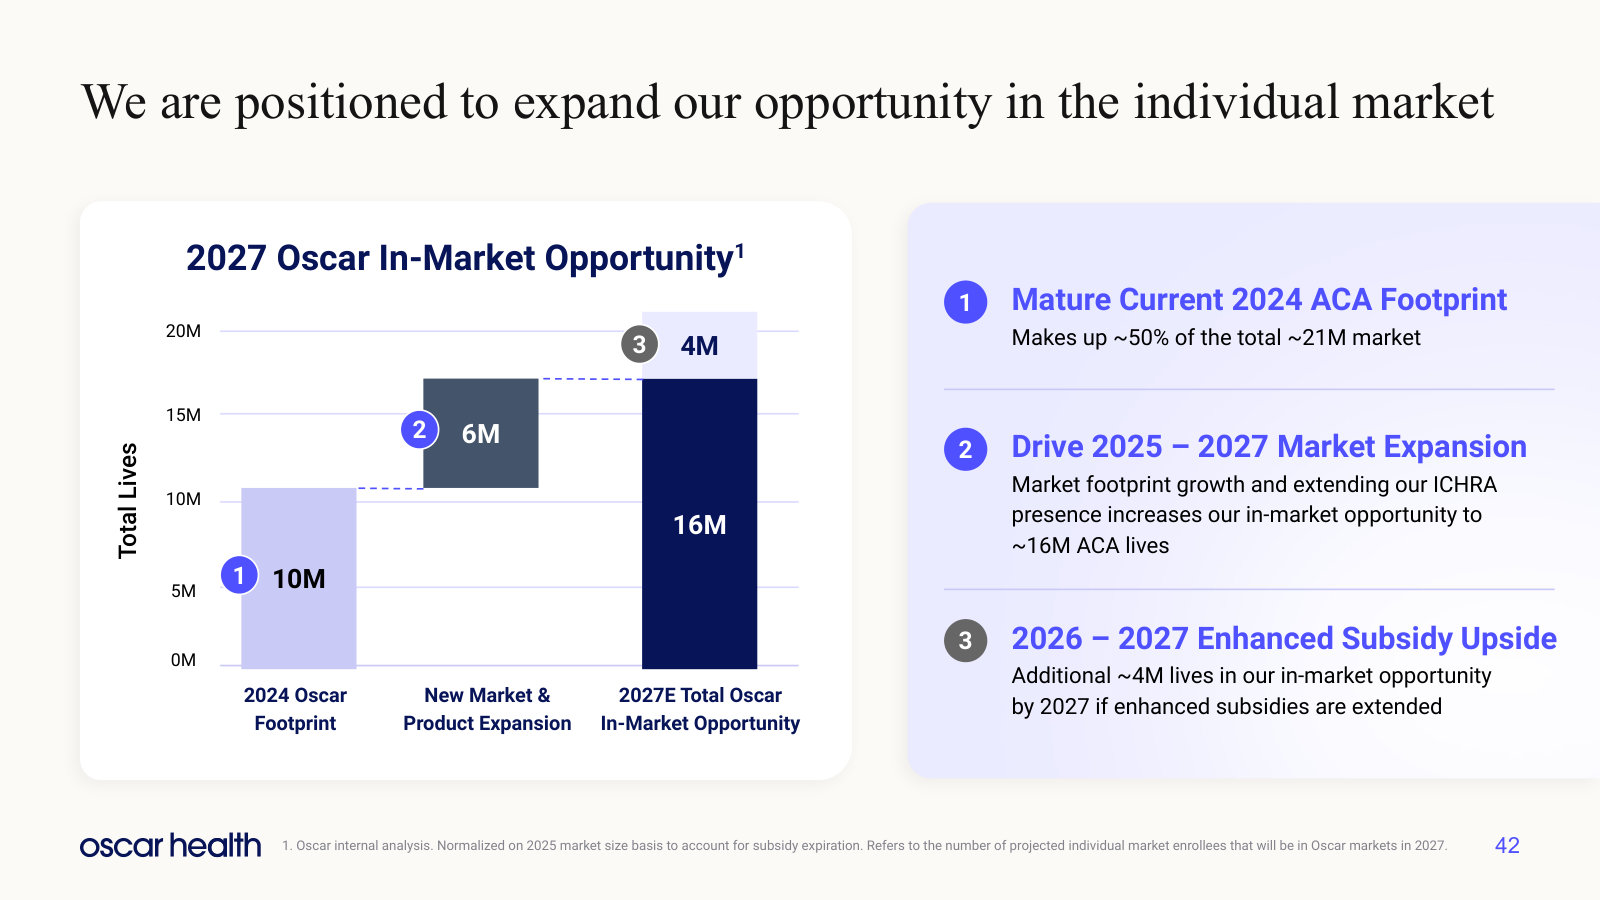
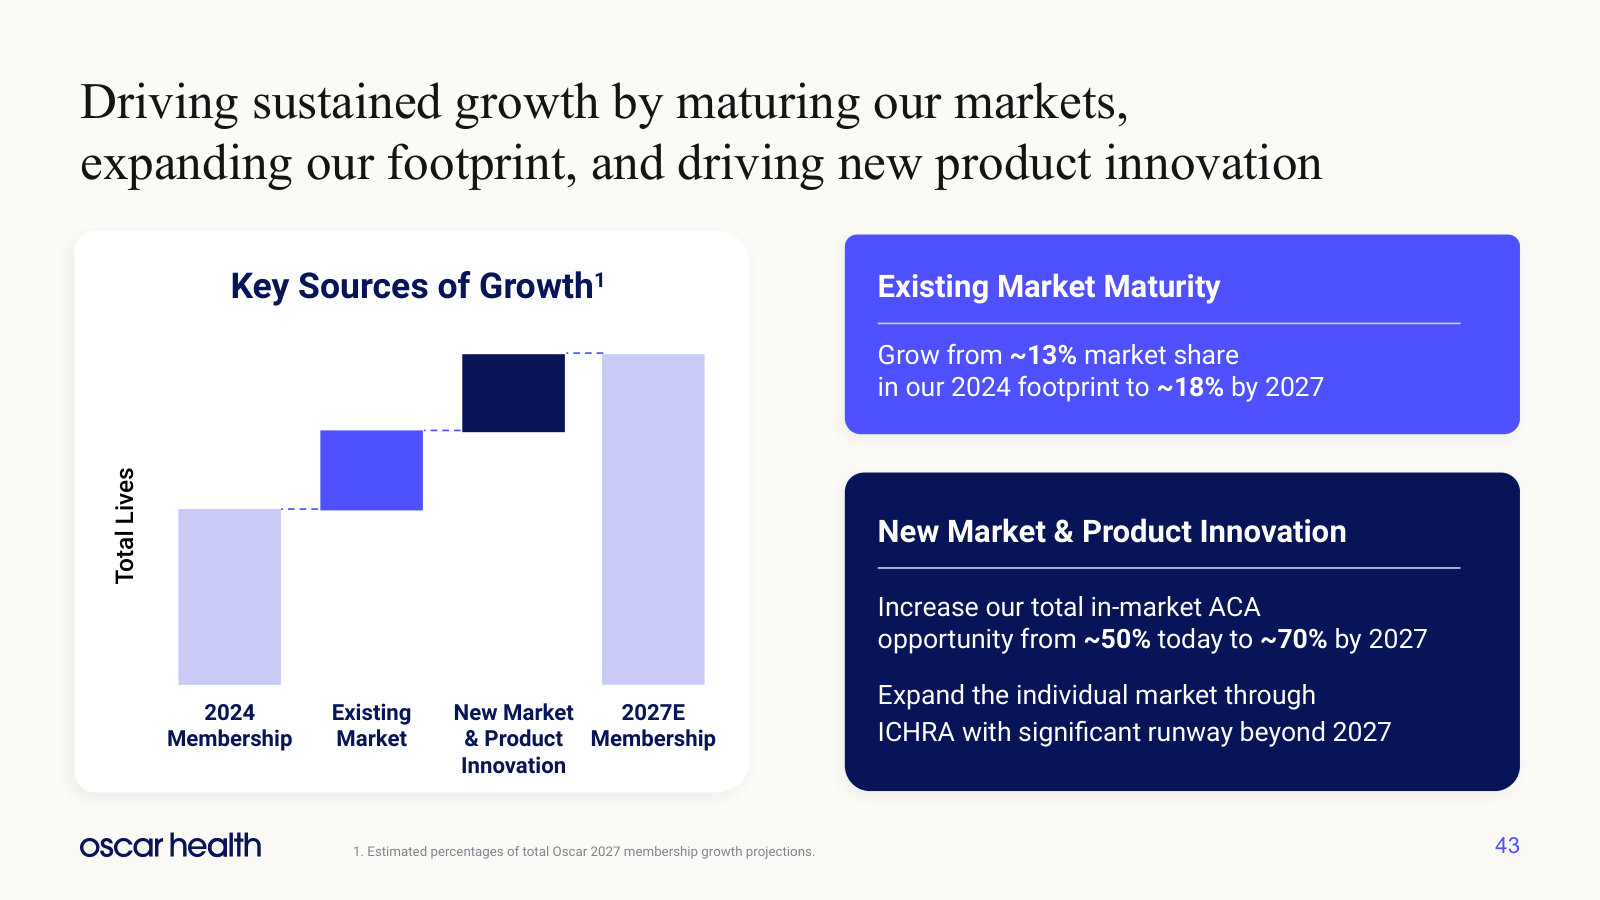
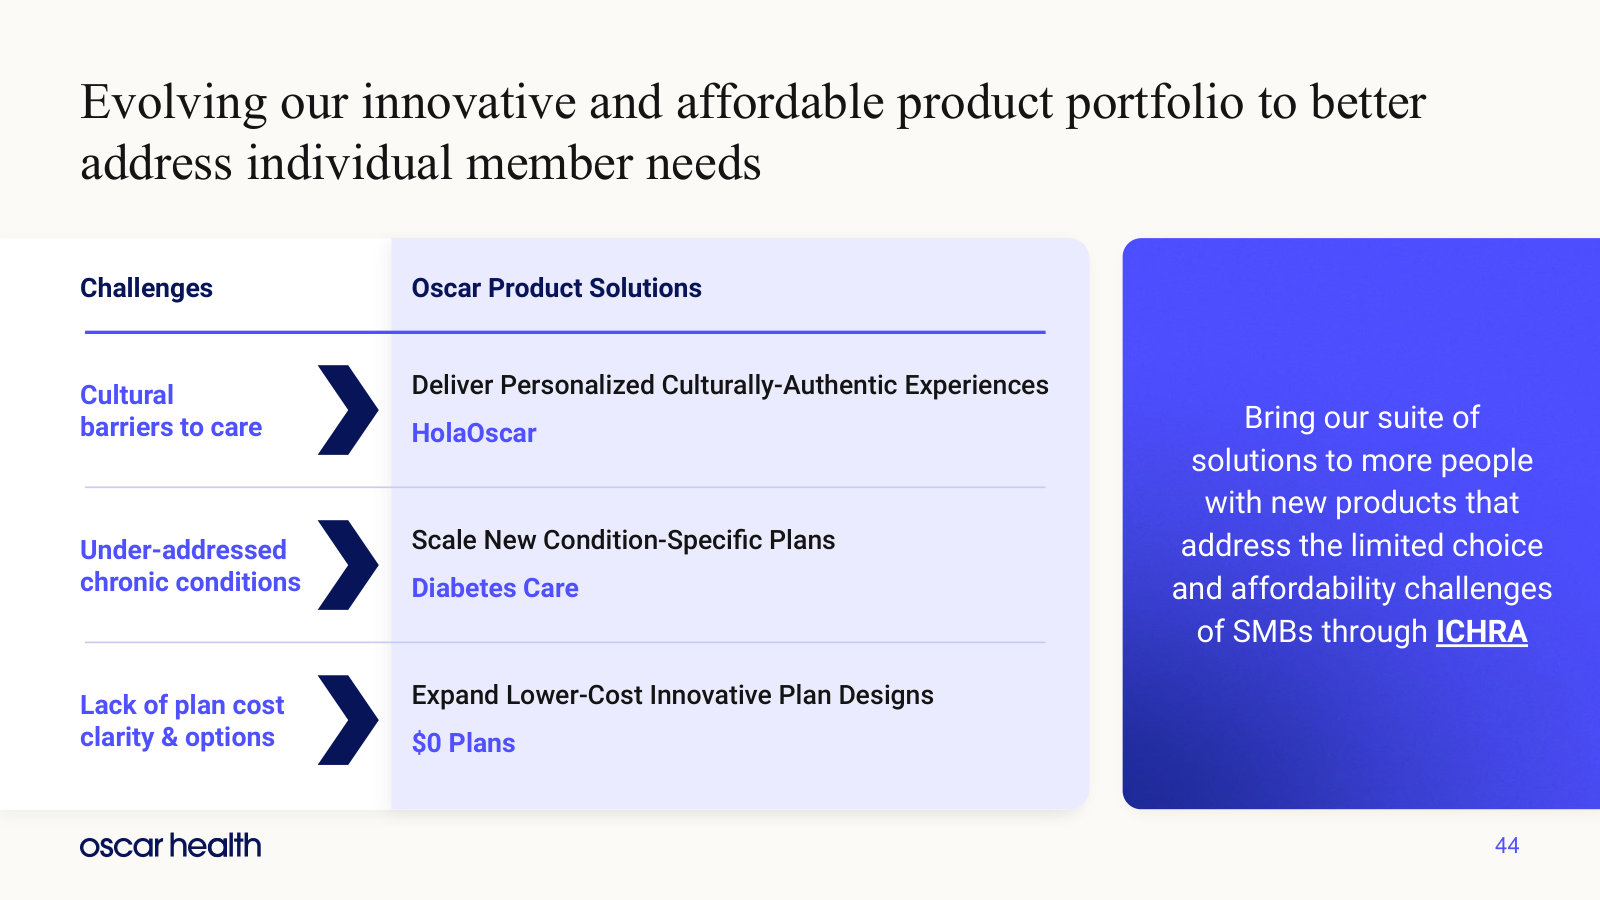
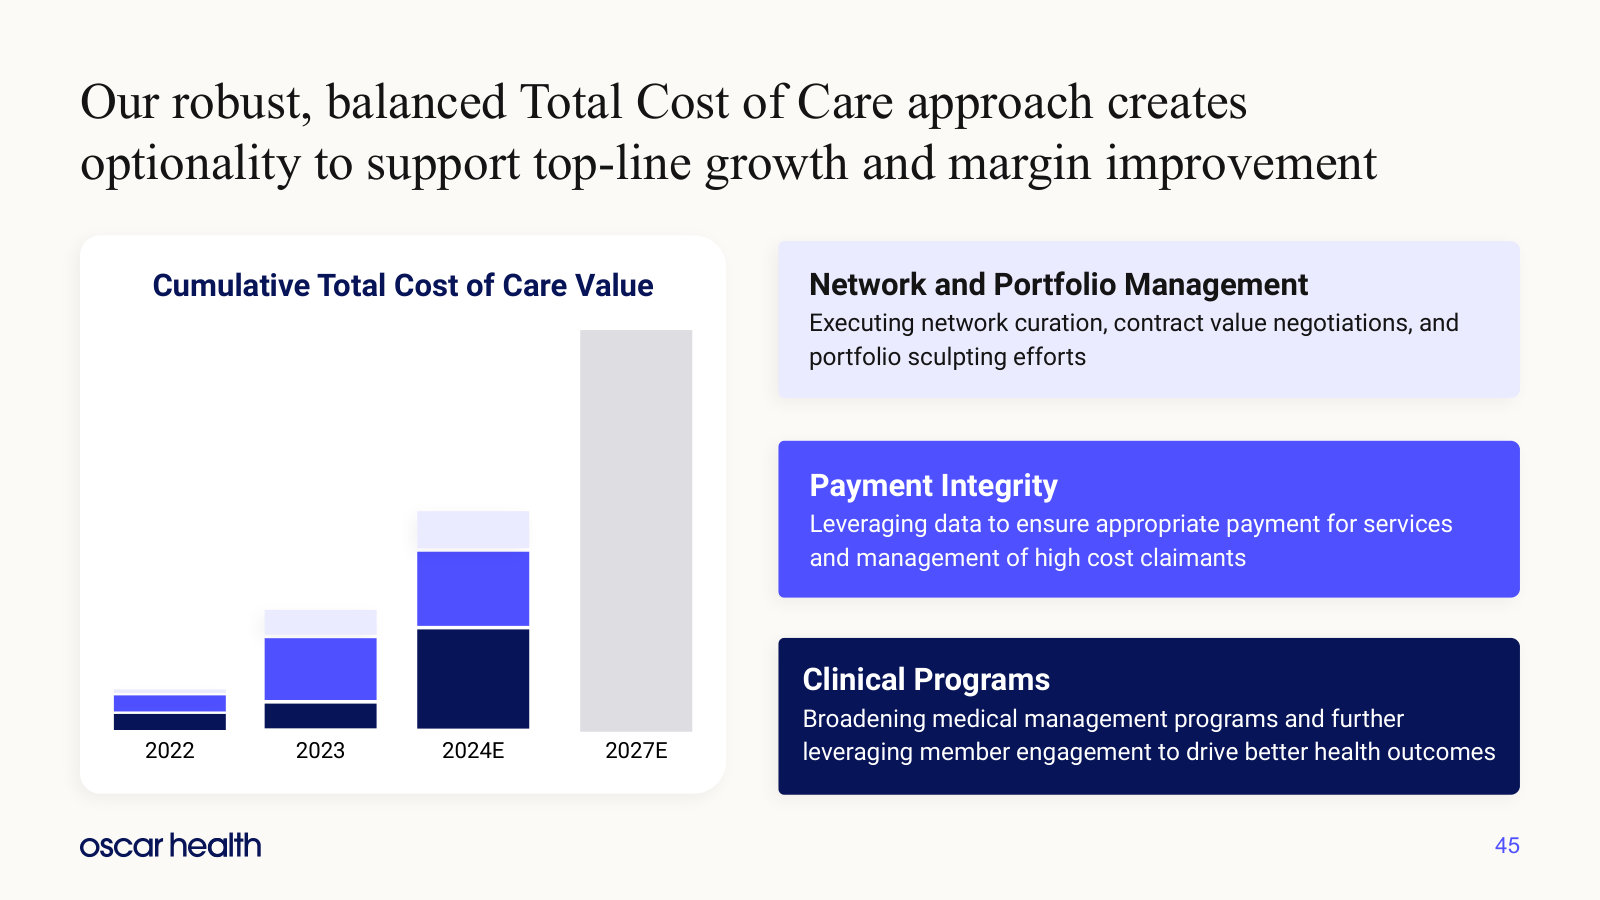
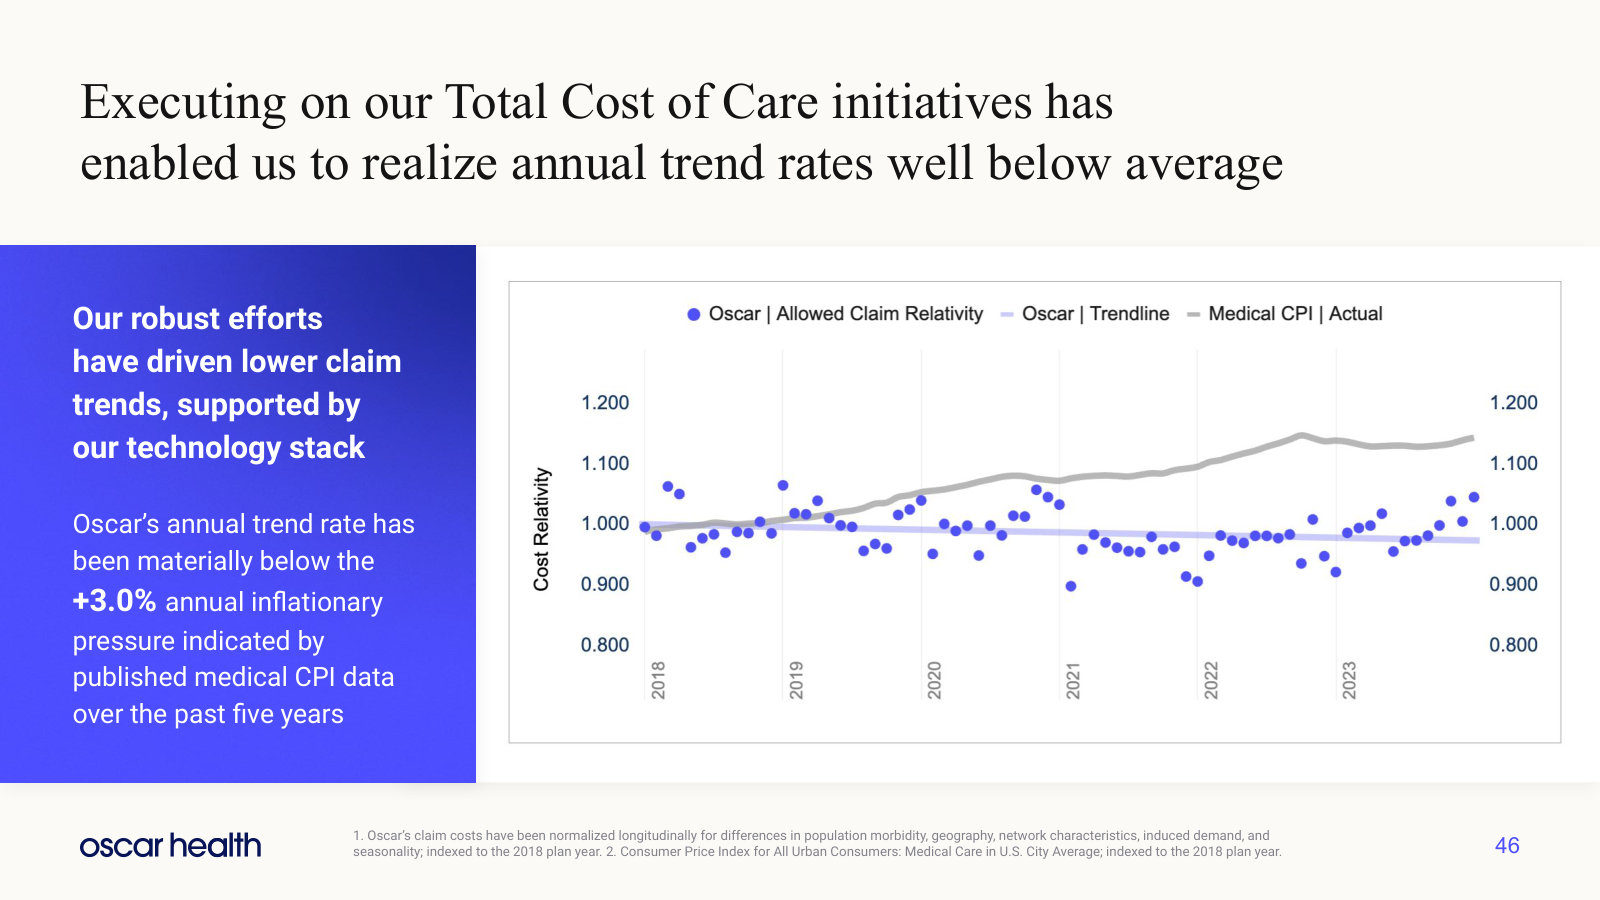
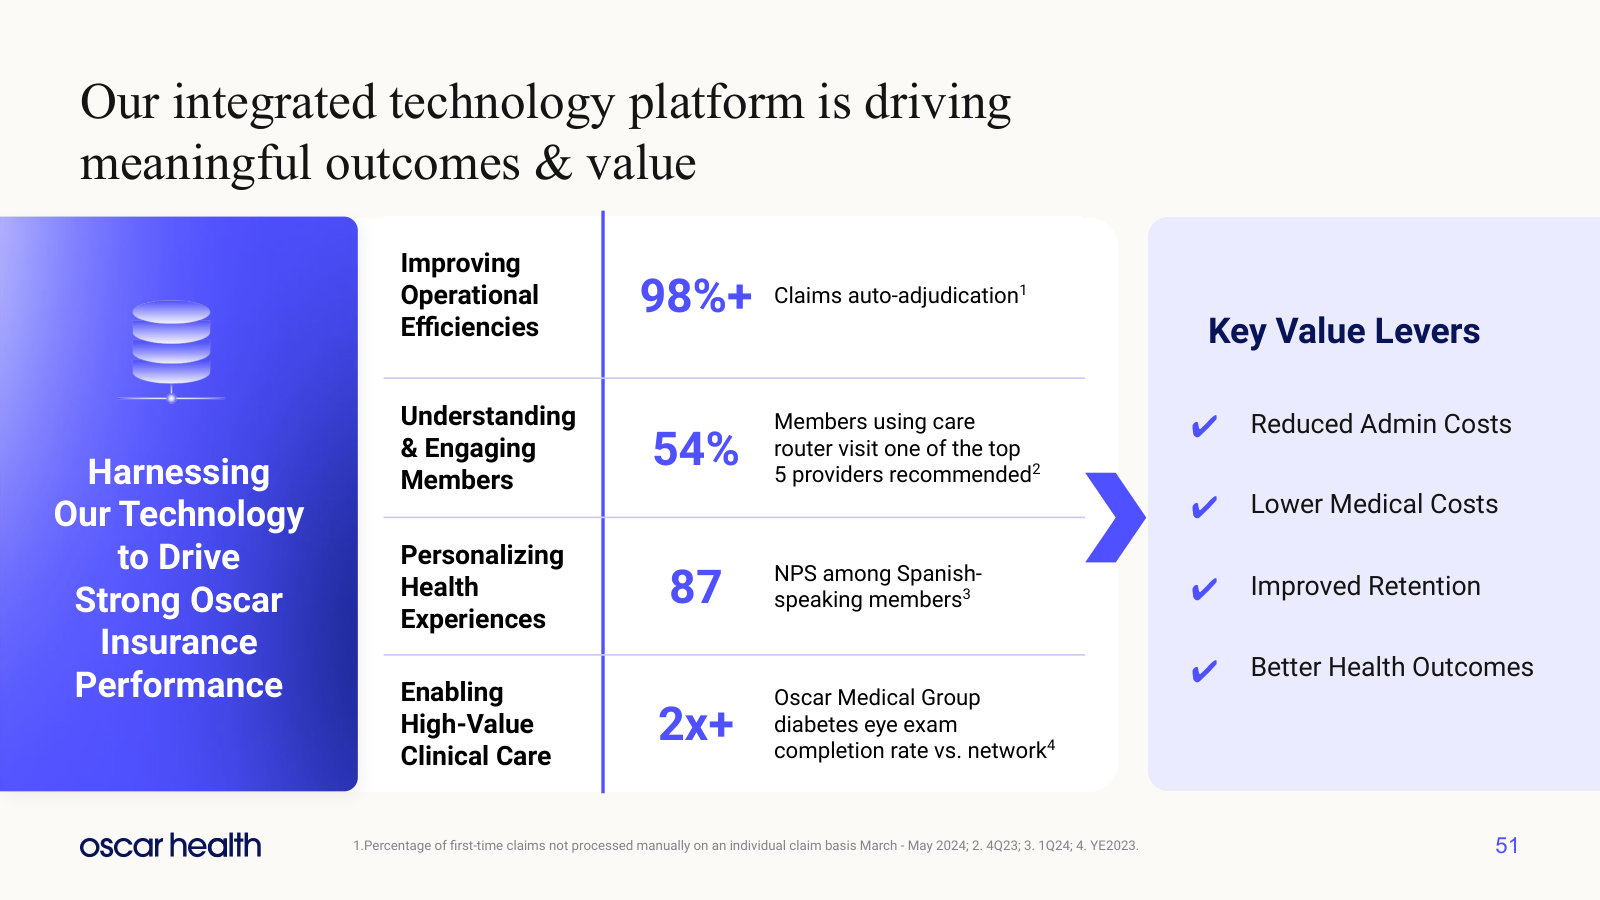
Investor Day 2024 — 2024
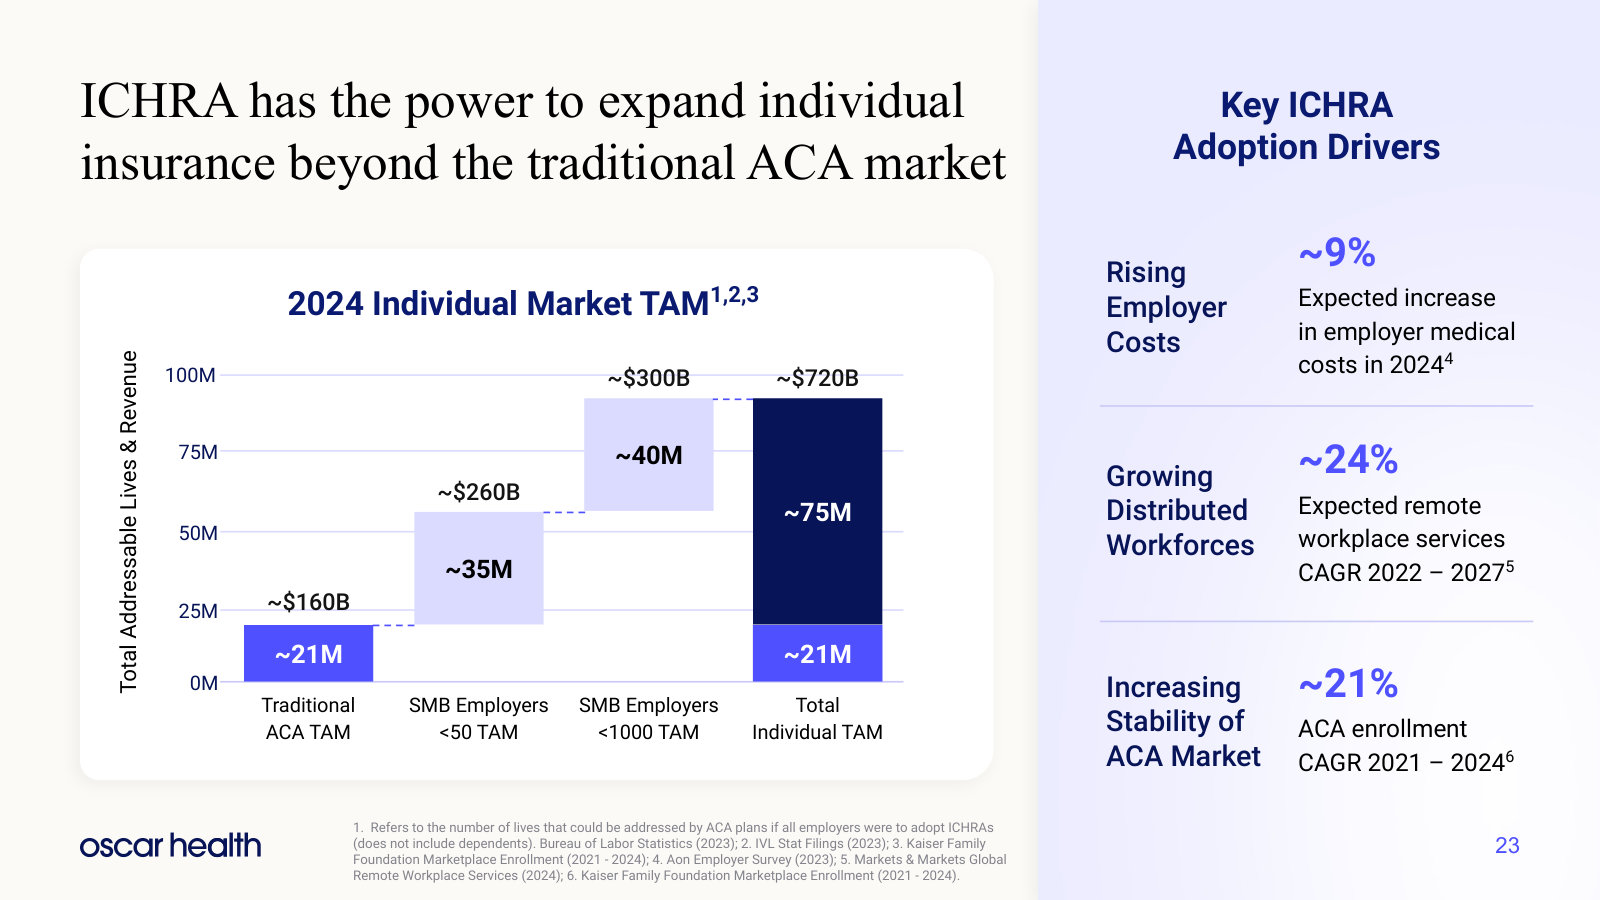
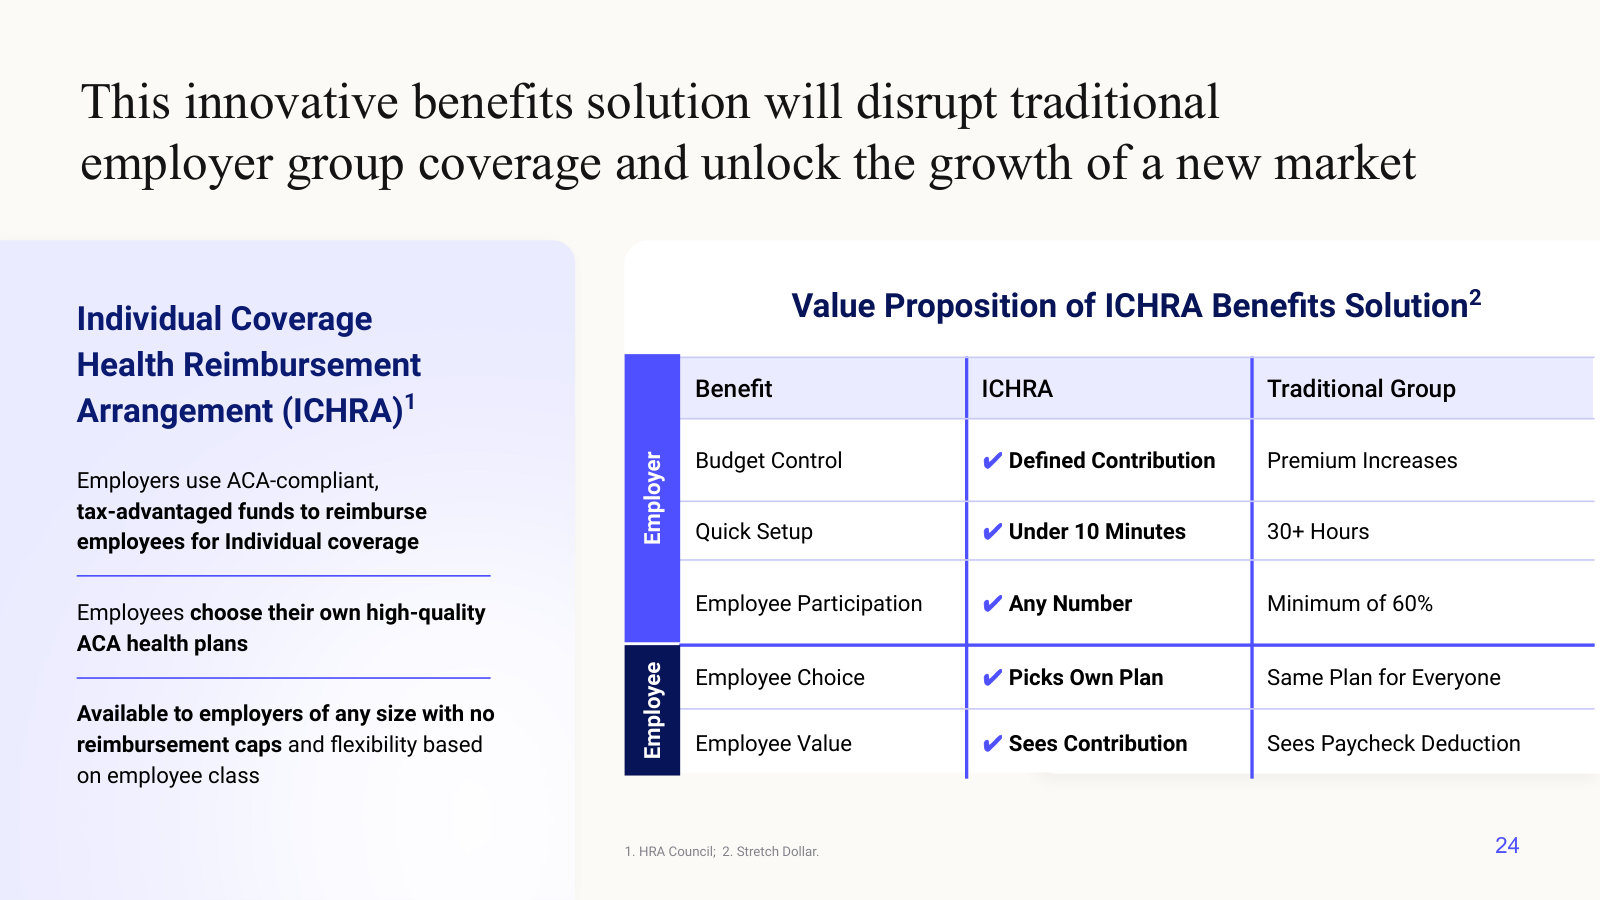
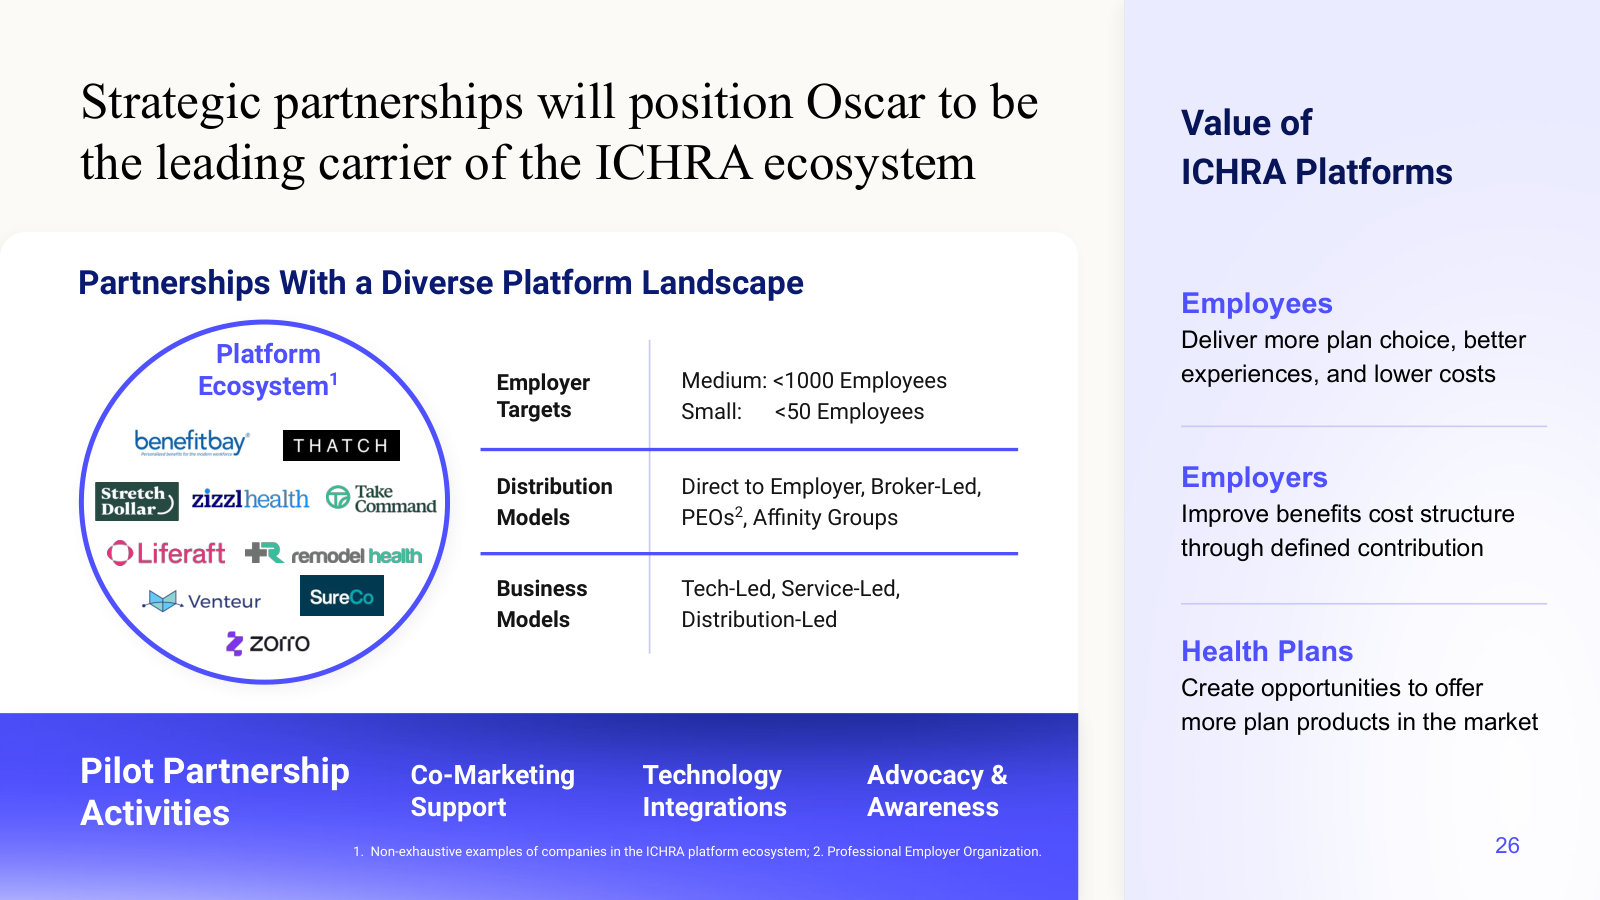
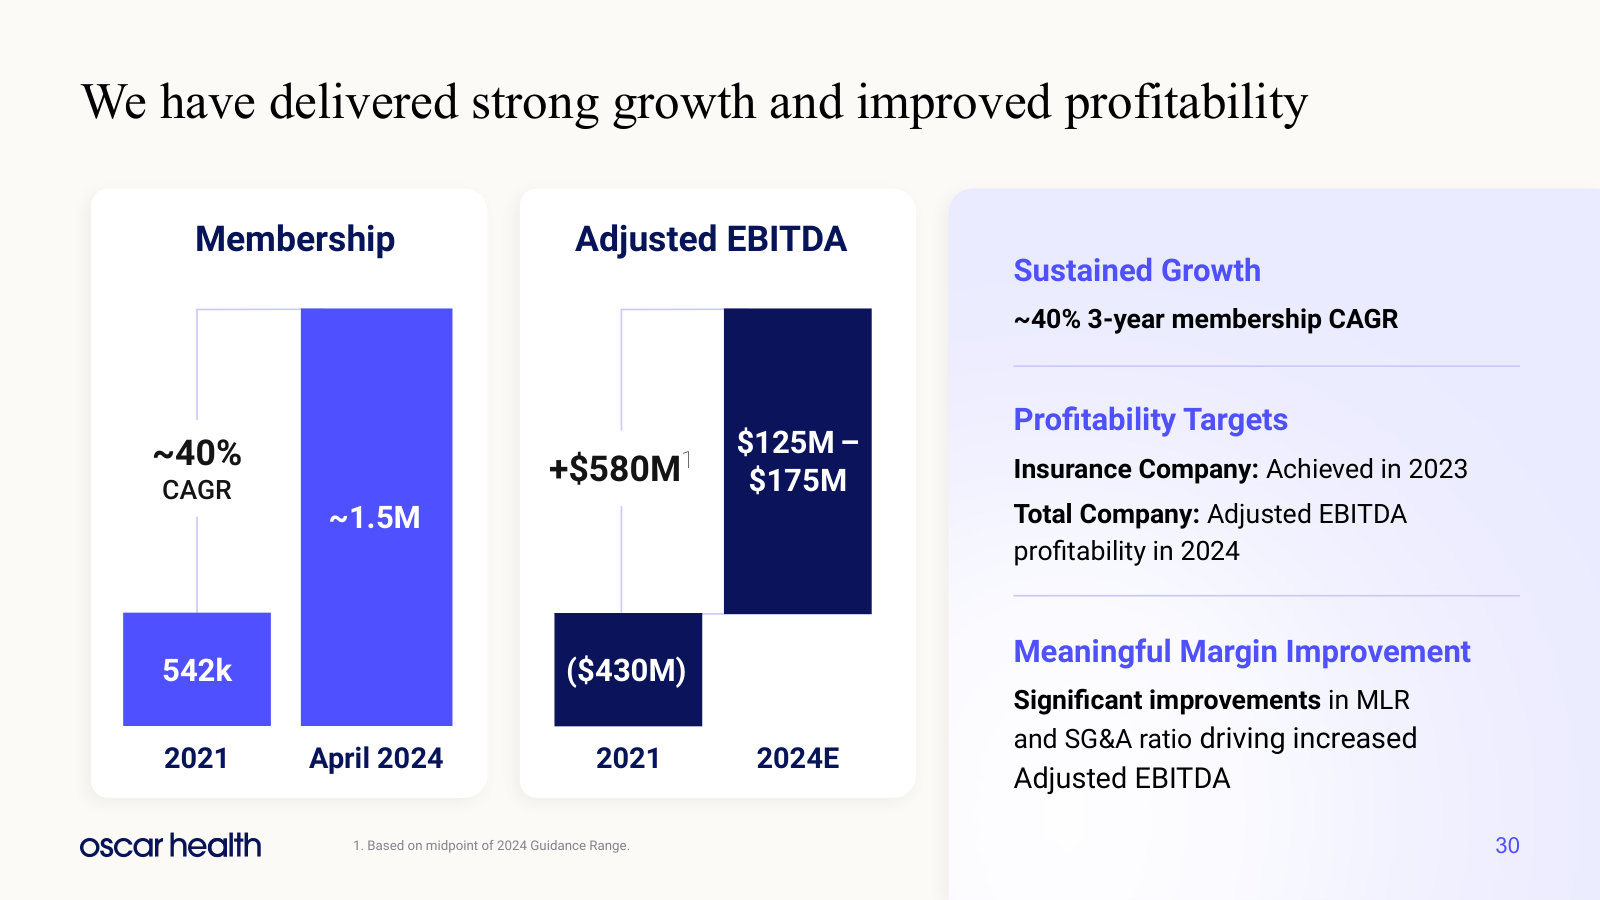
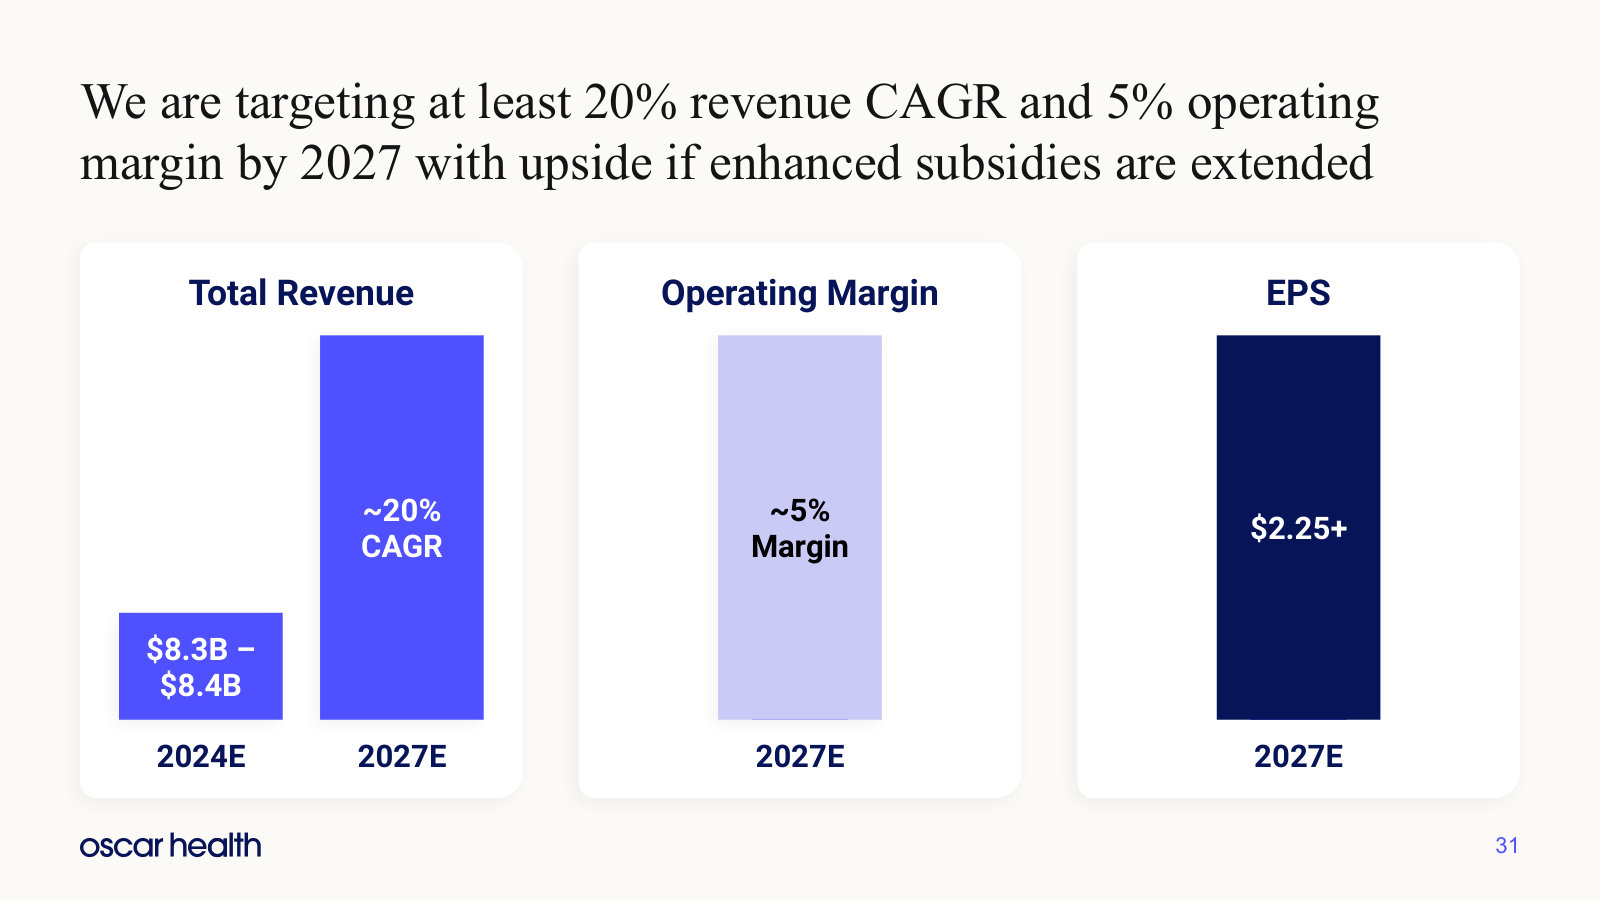
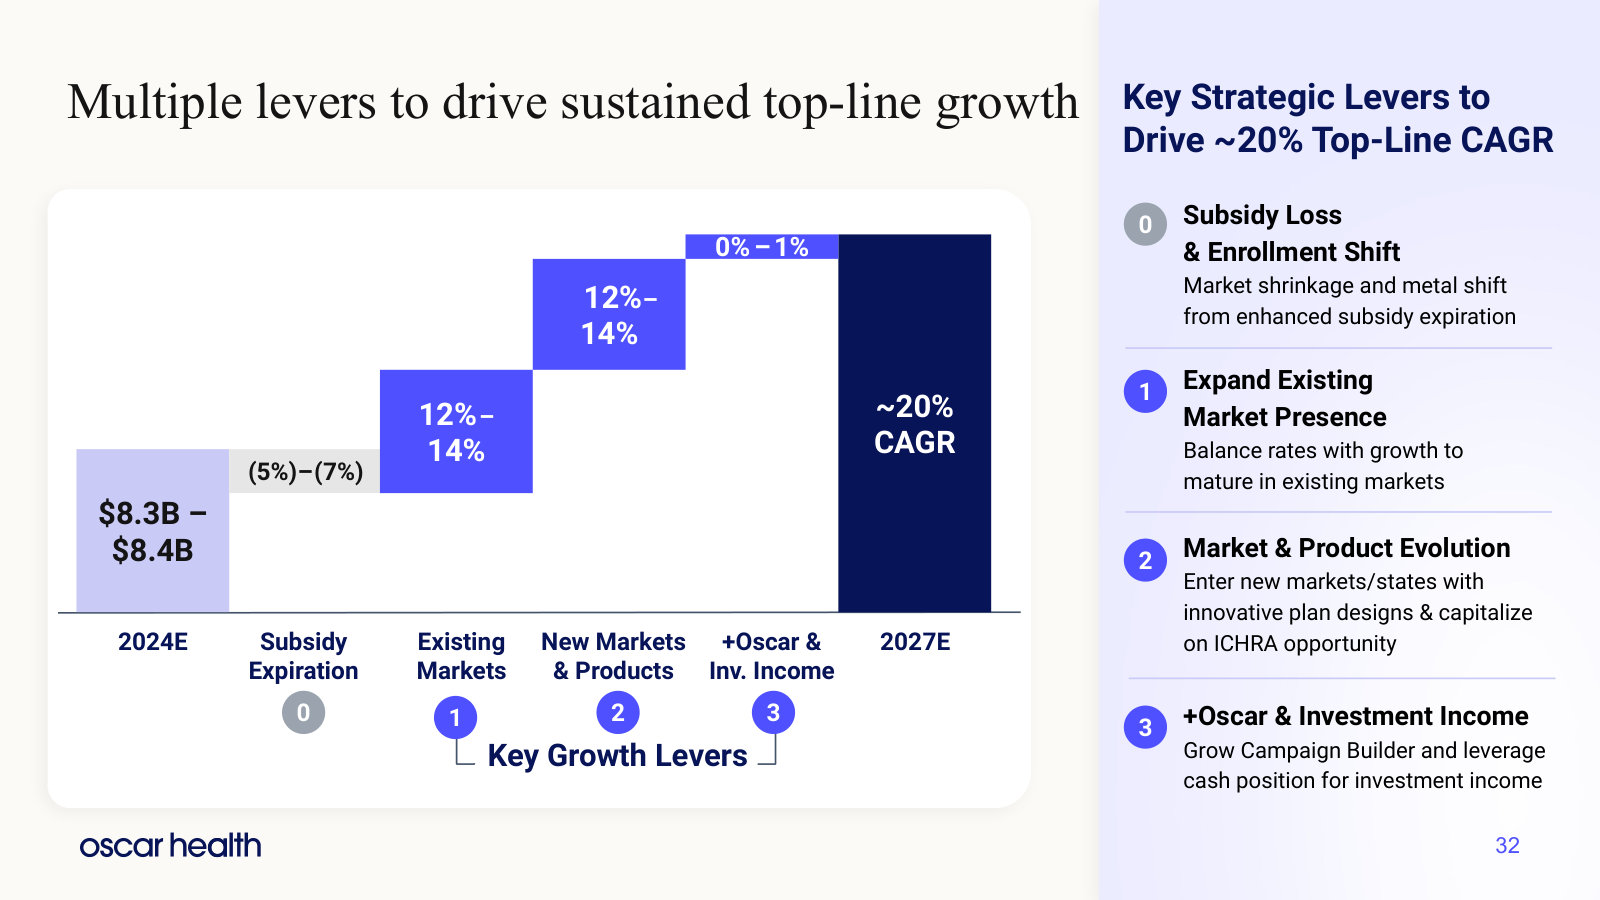
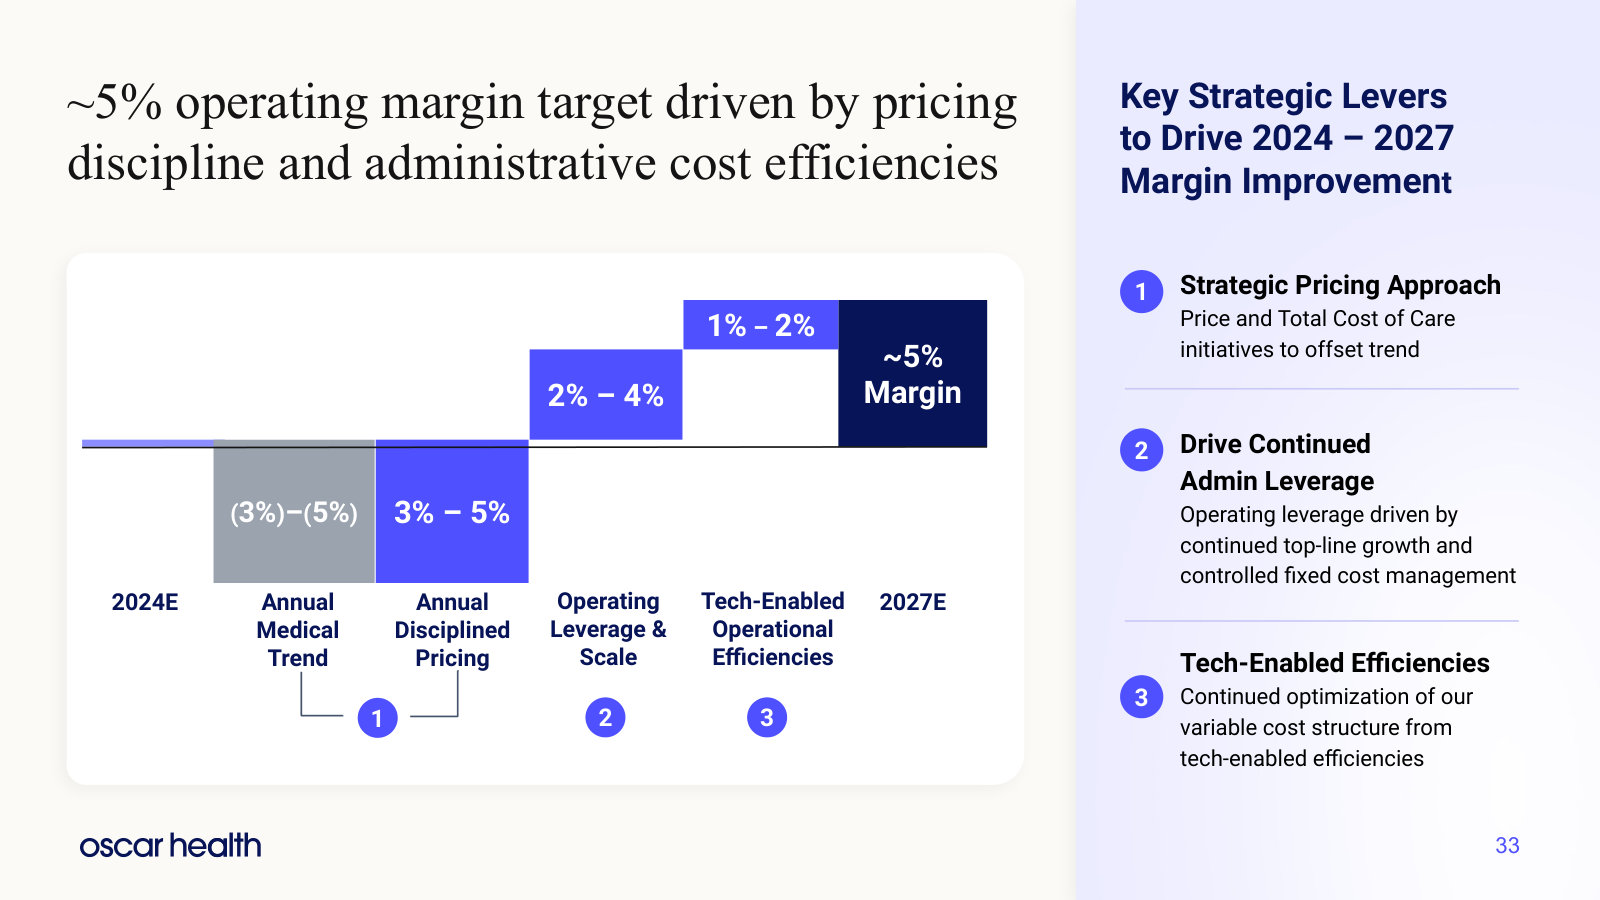
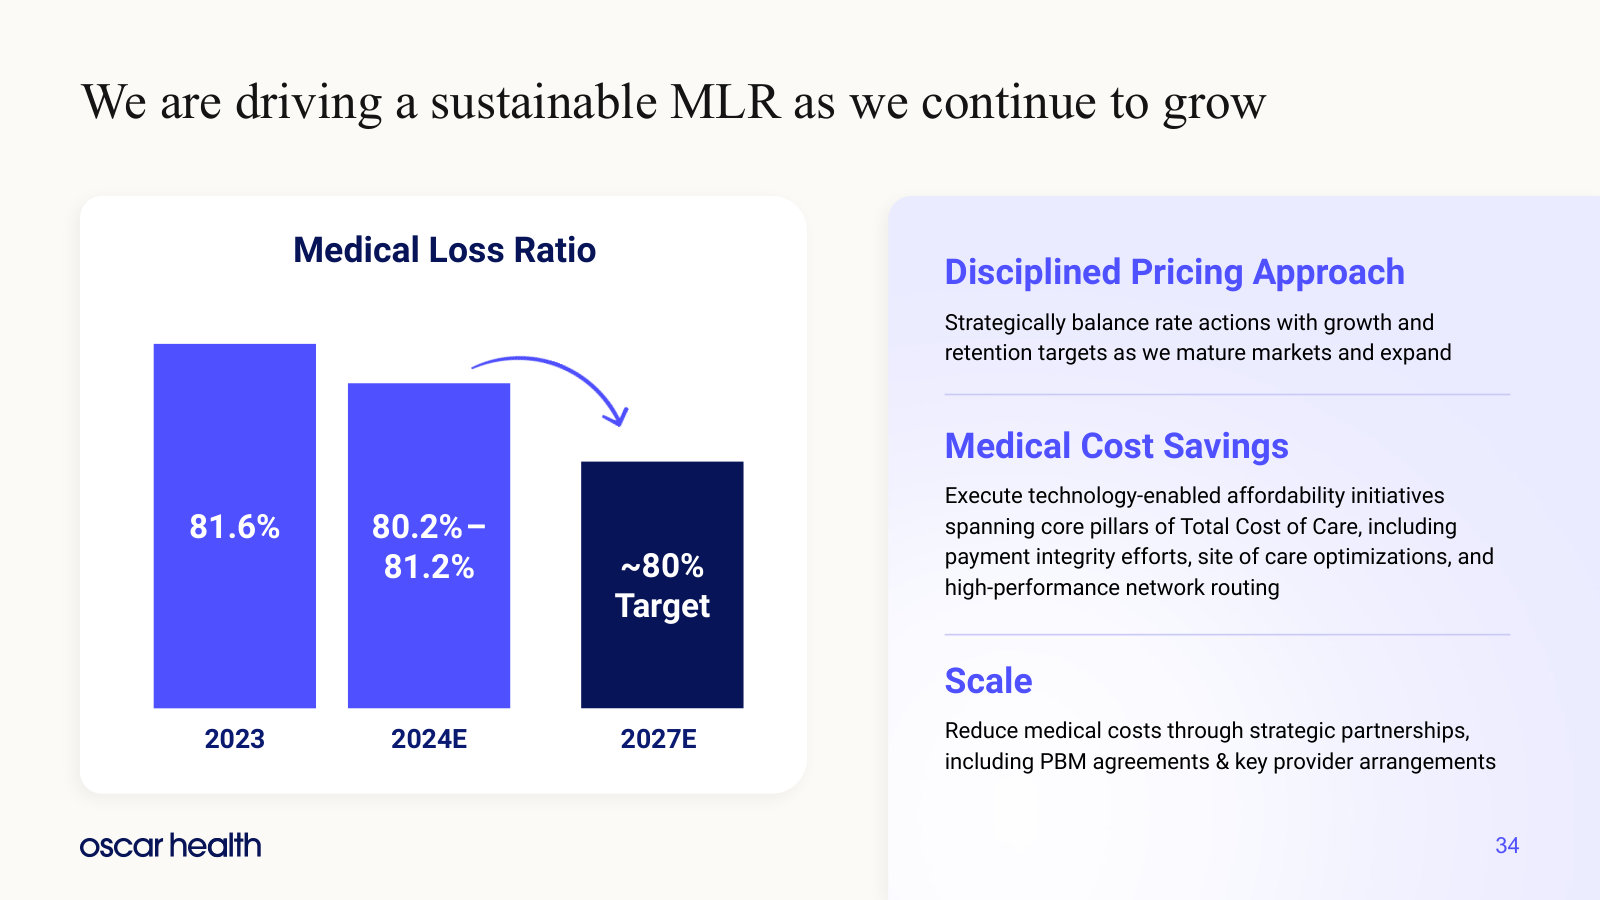
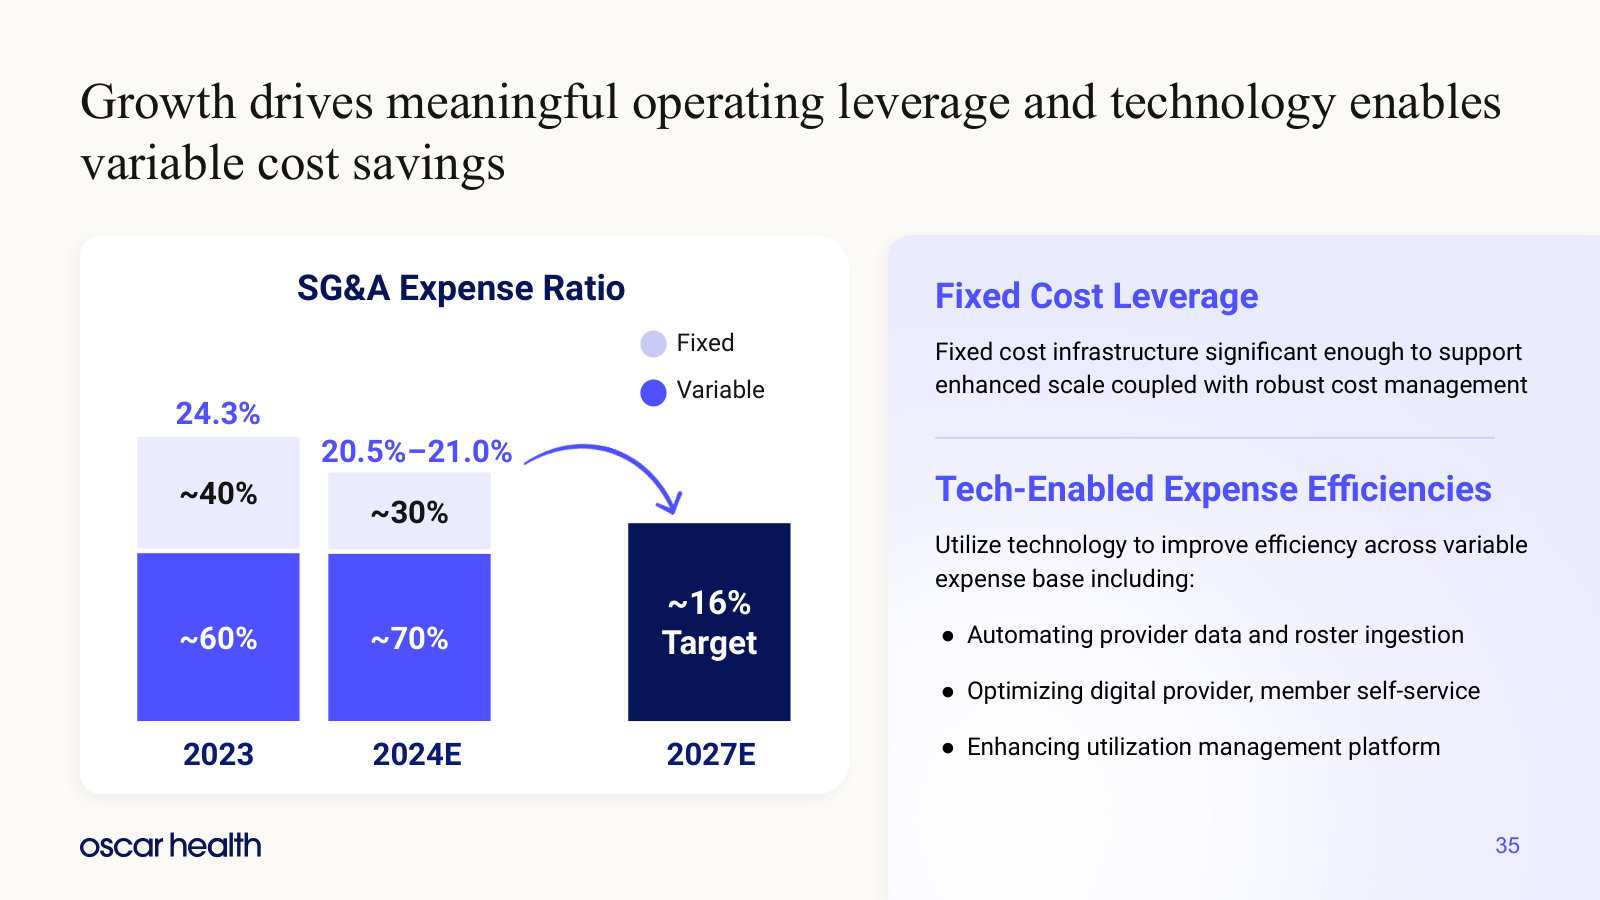
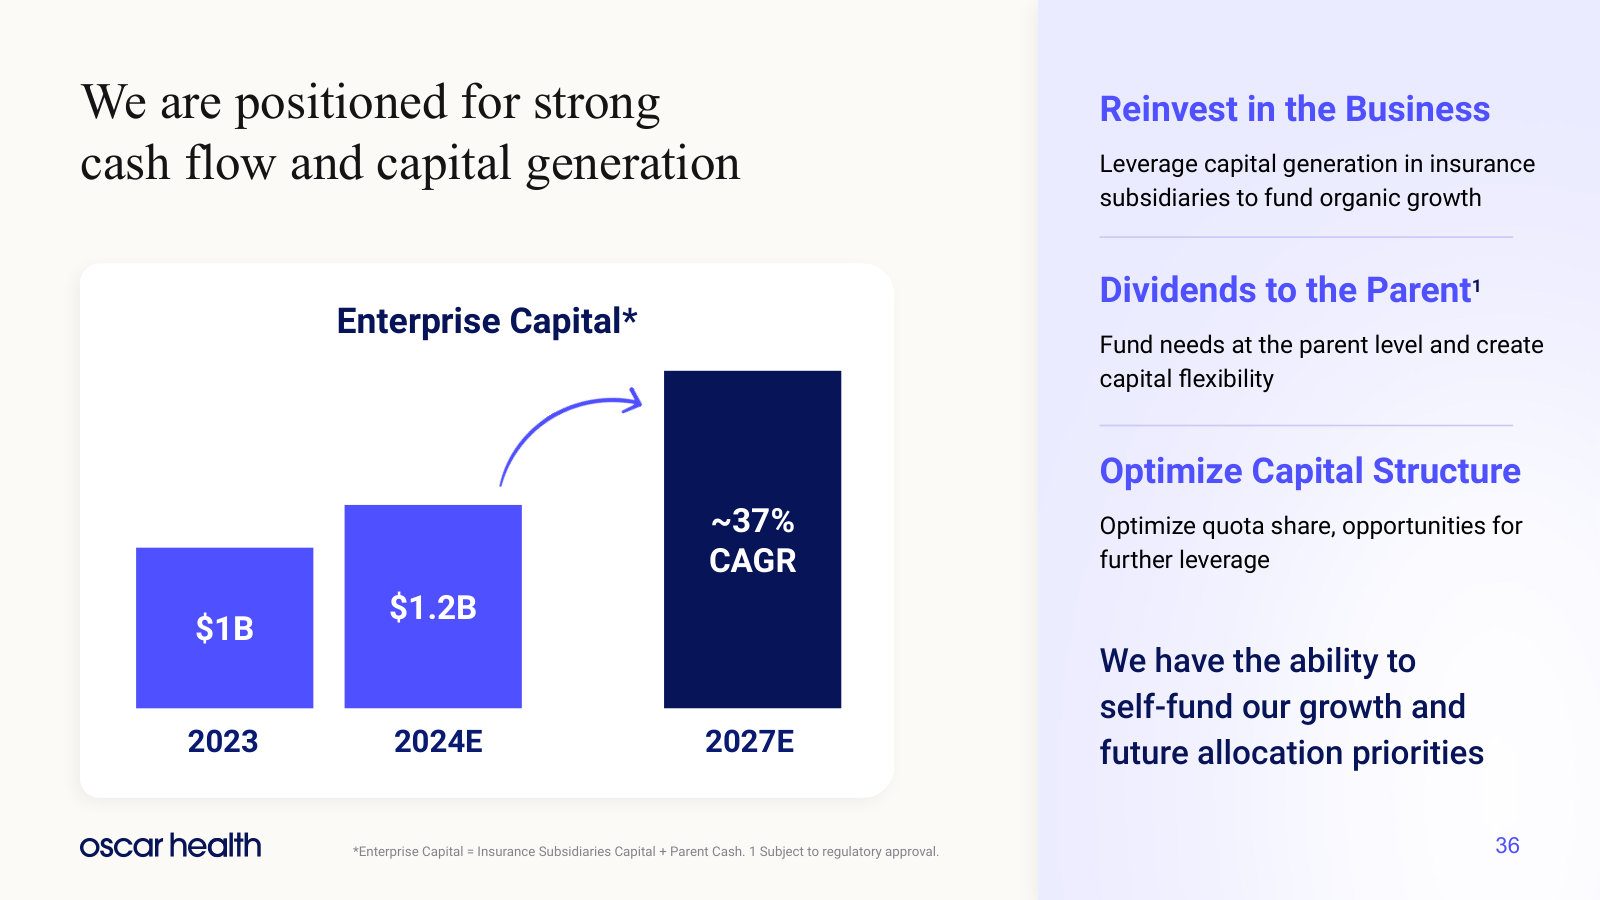
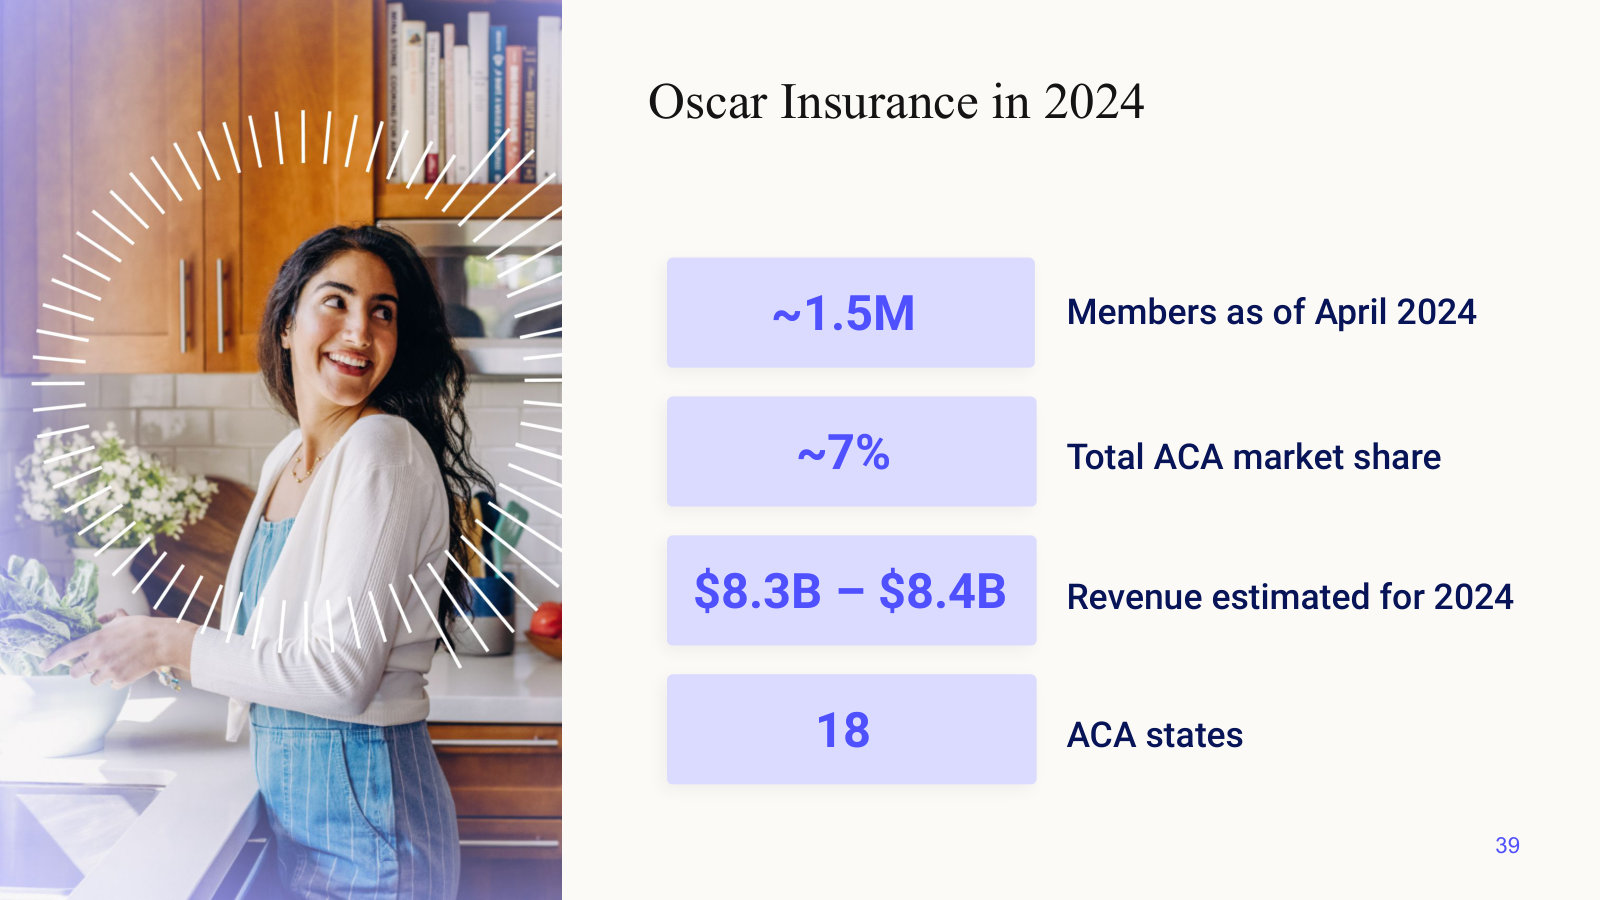
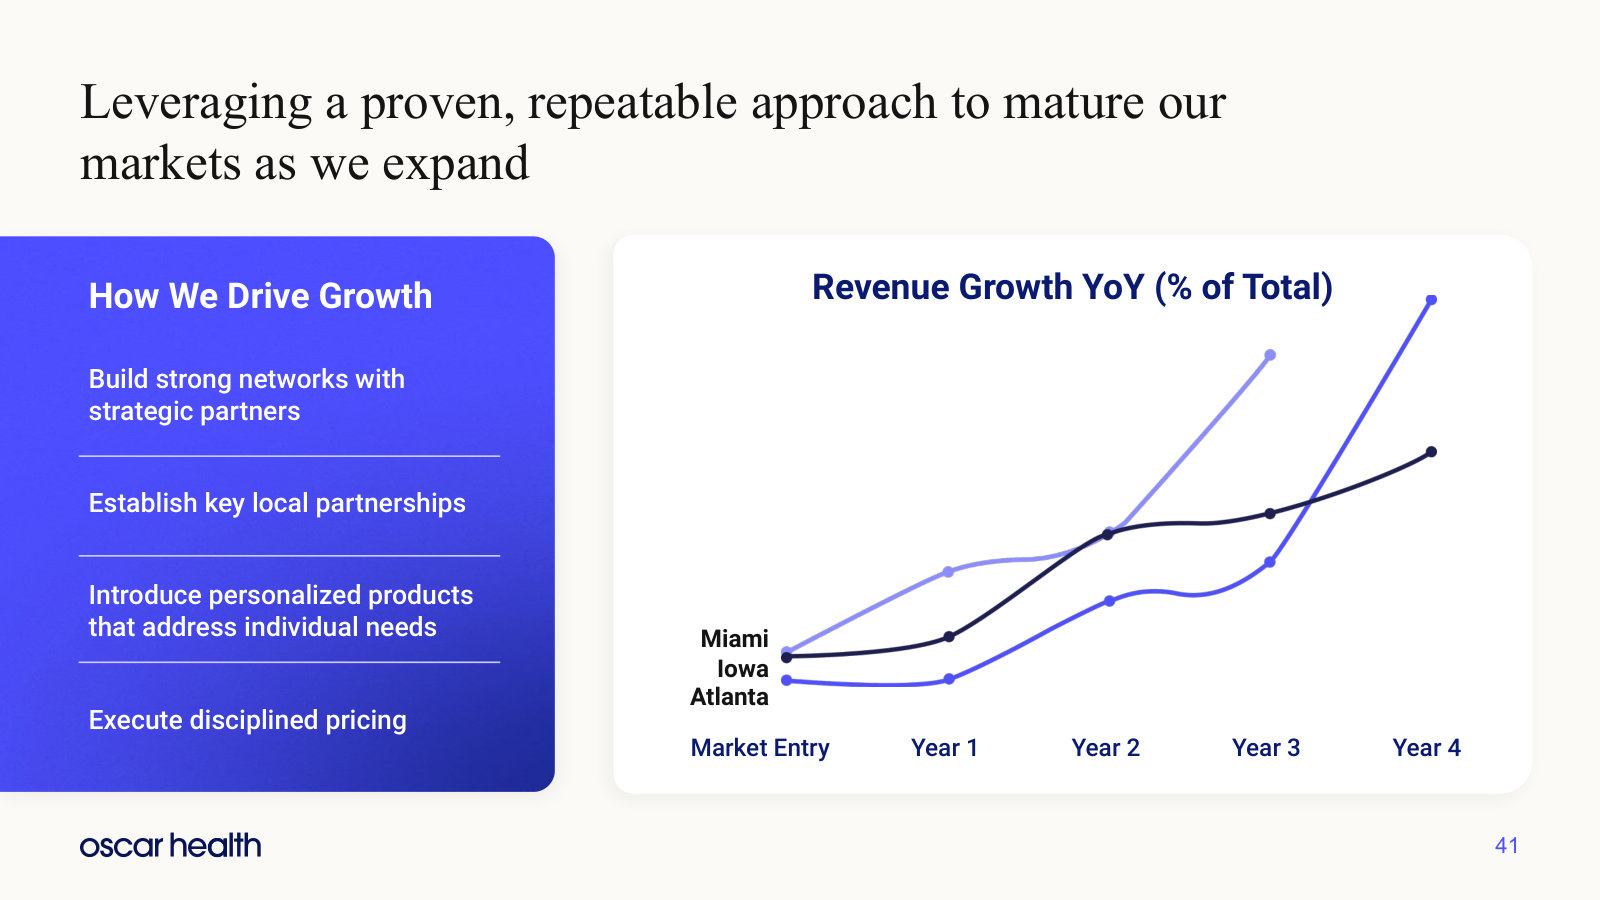
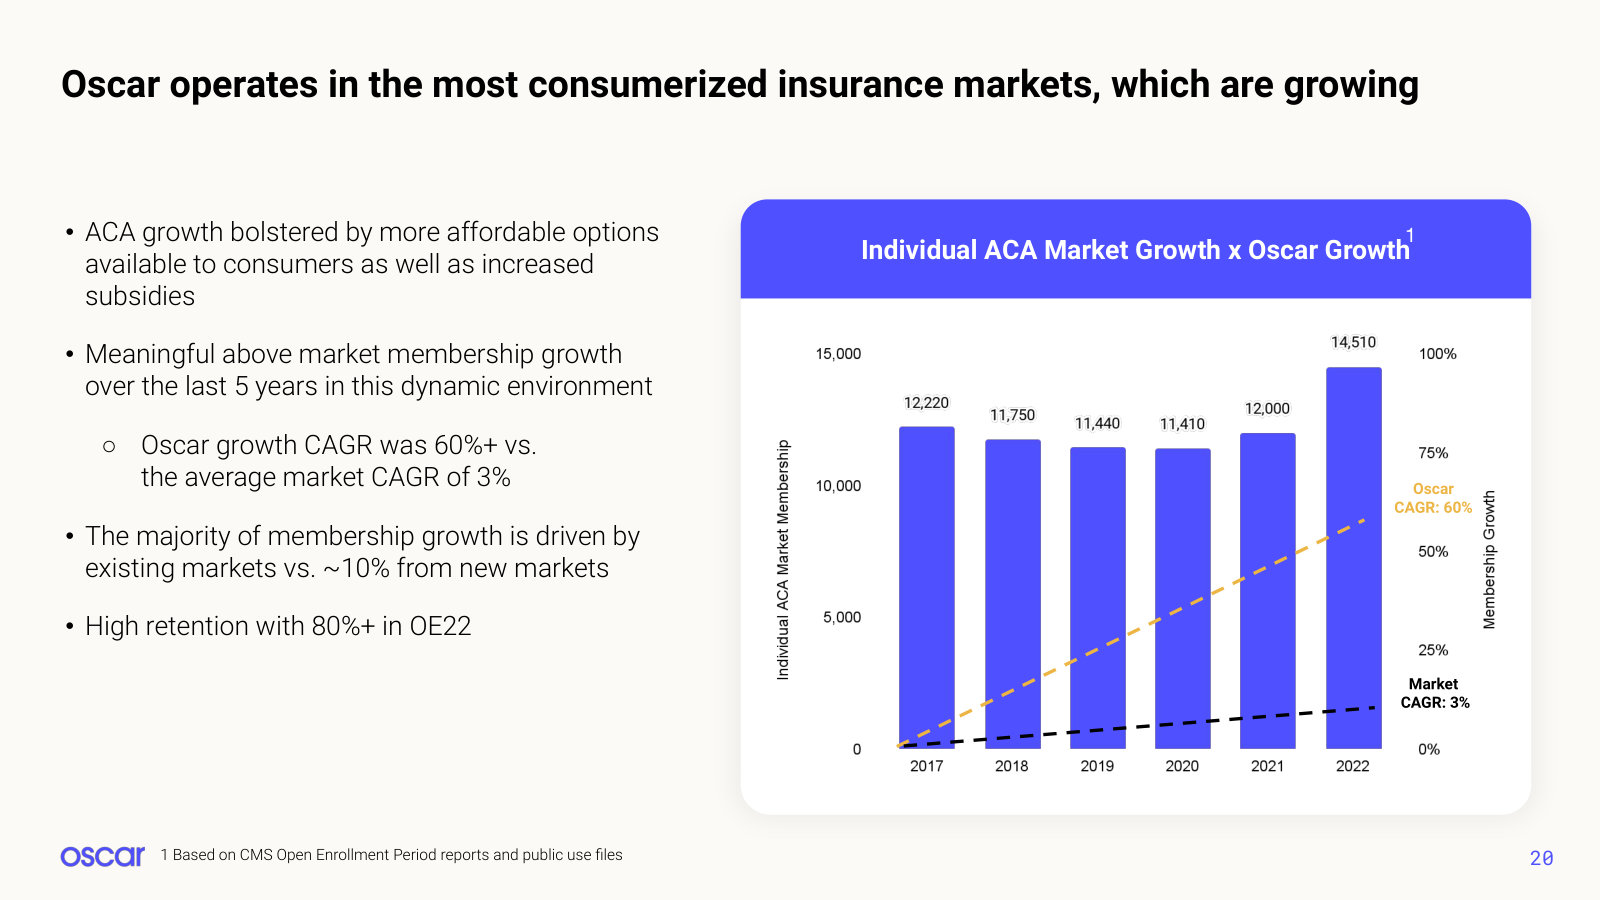
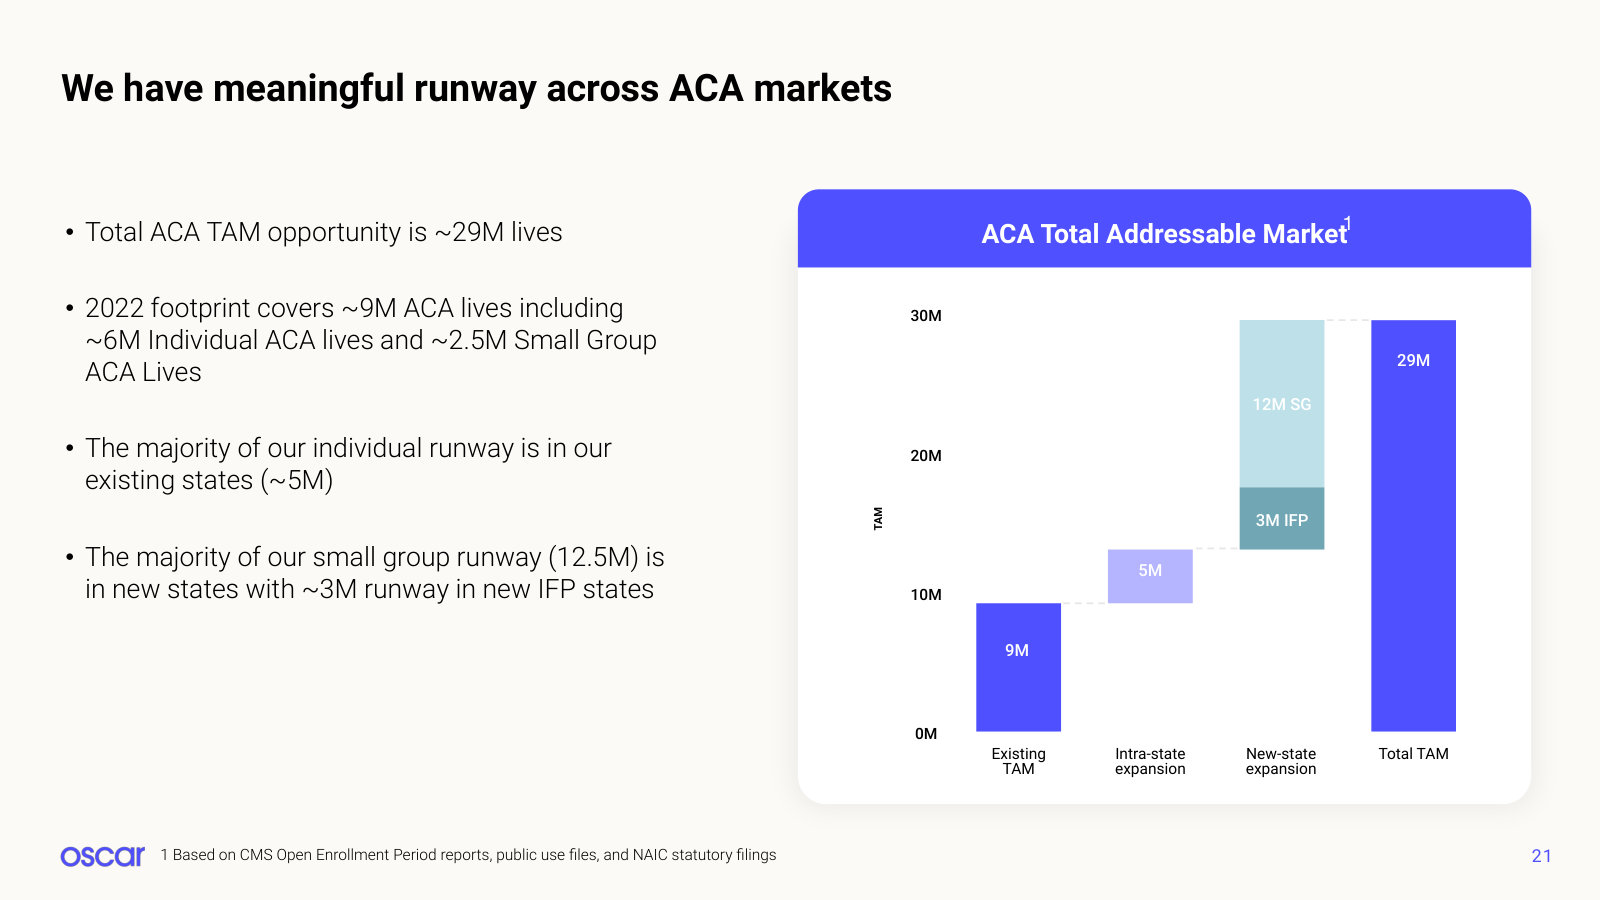
Oscar's most complete public explanation of itself: strategy, market structure, unit economics and the 2027 targets management set. · Open the full document →
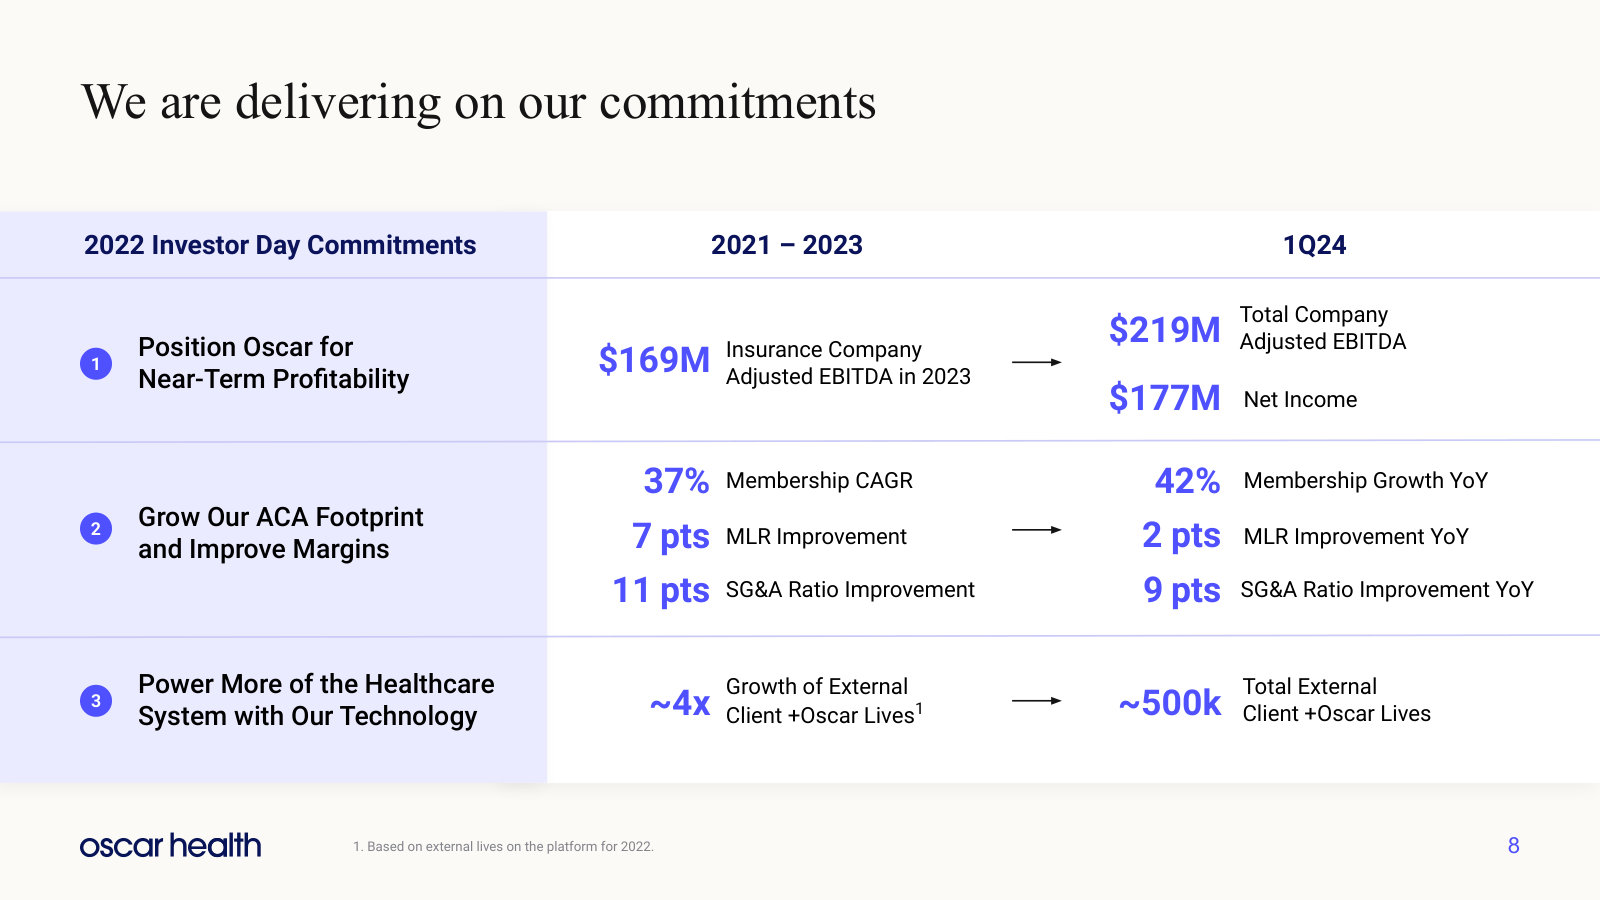
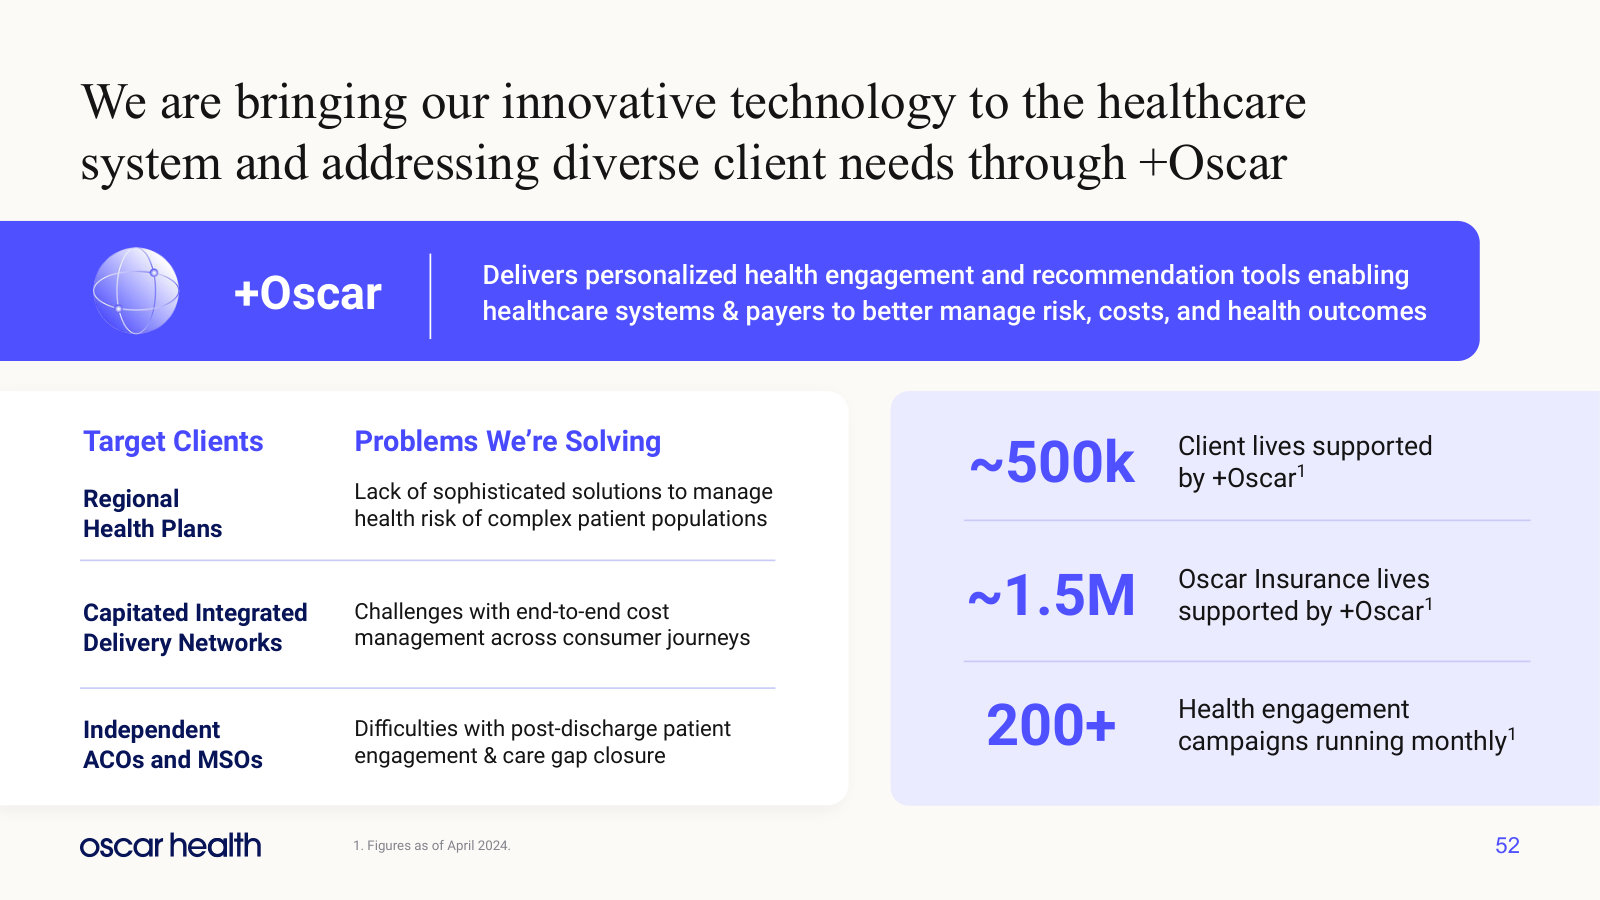
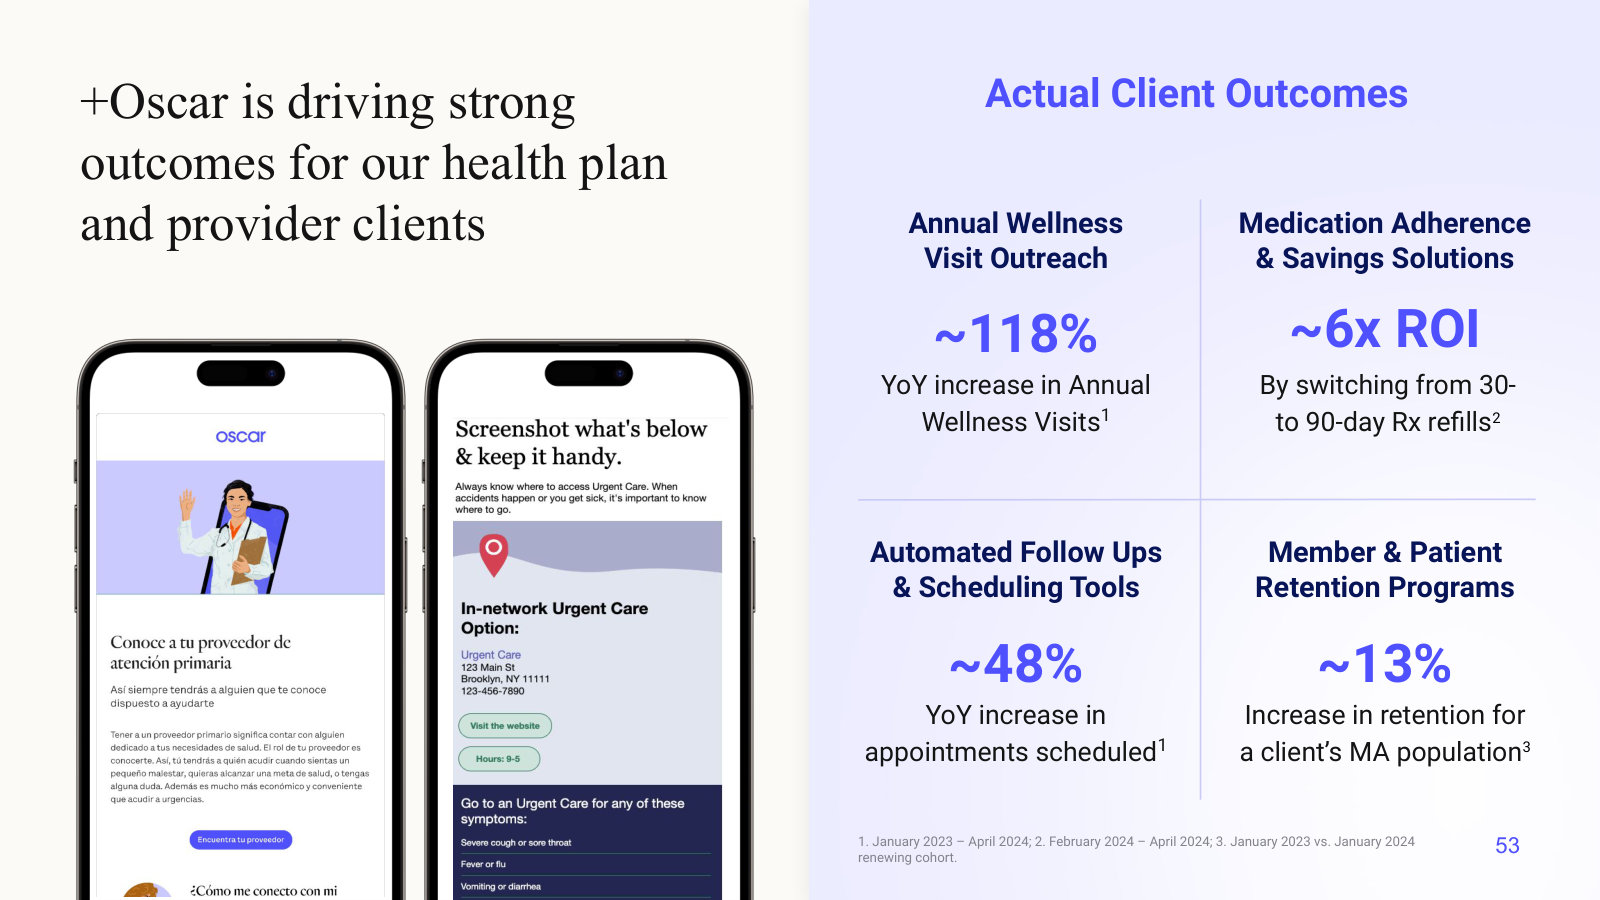
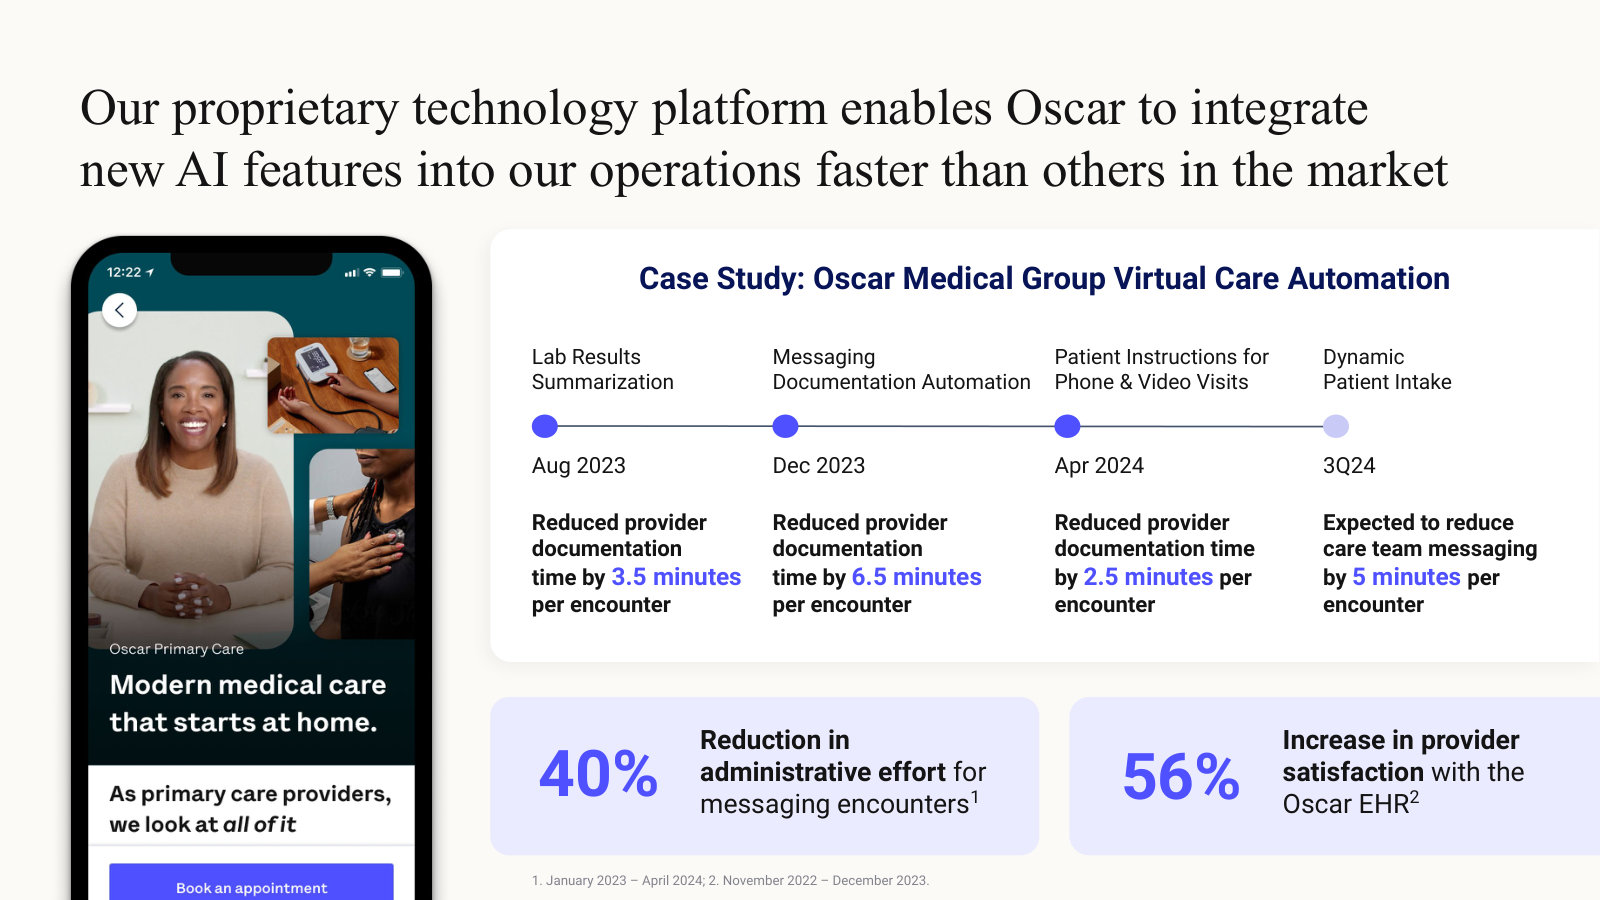
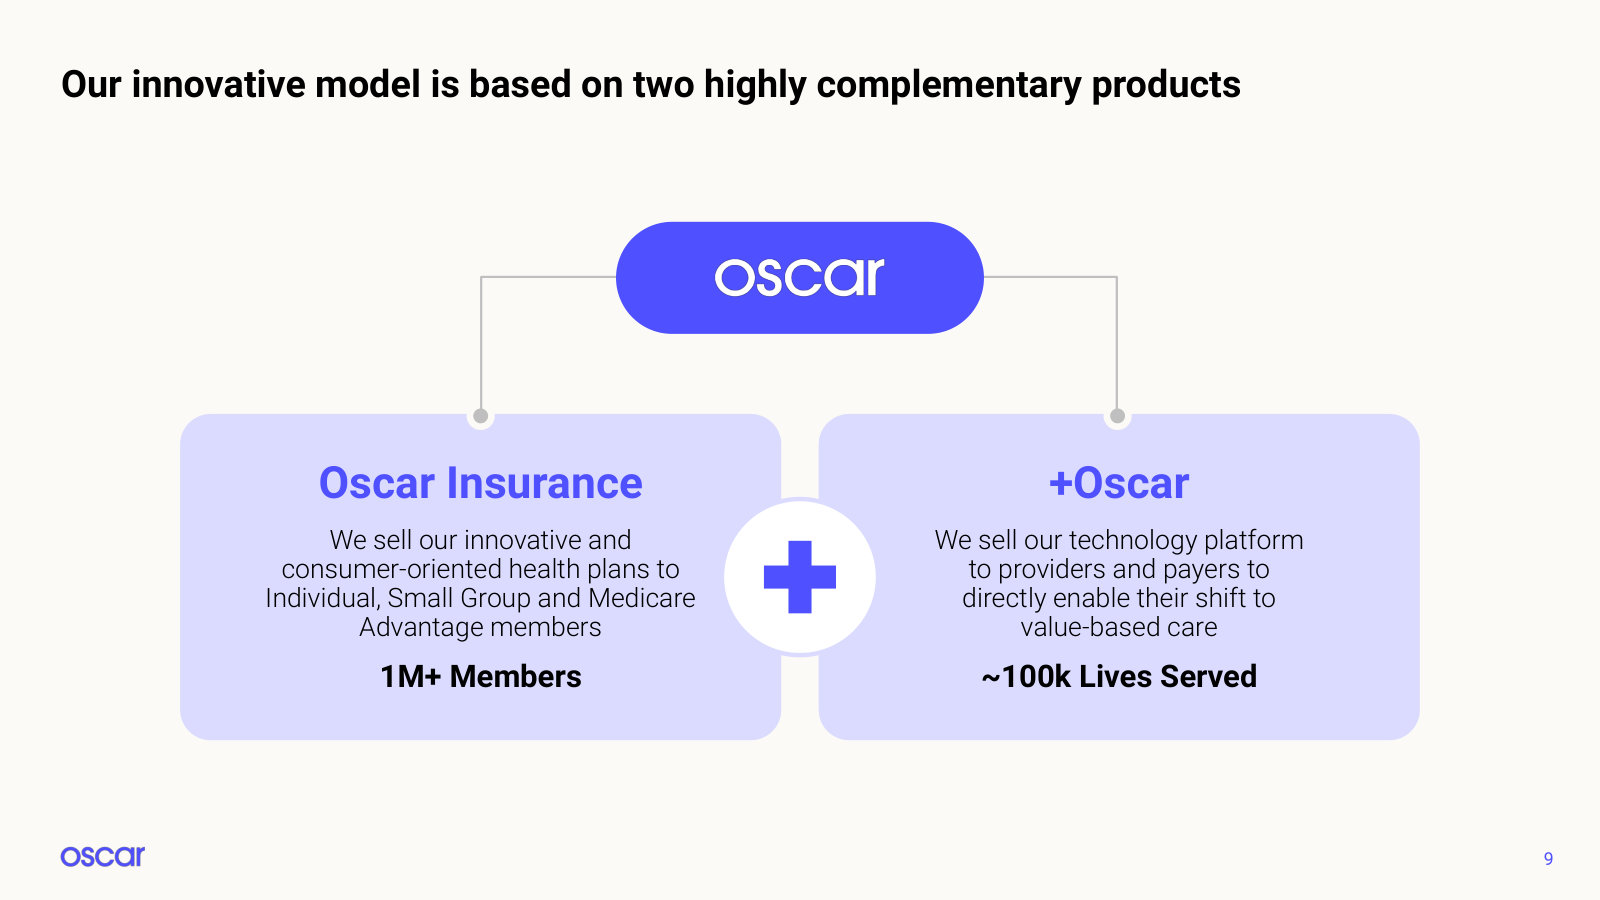
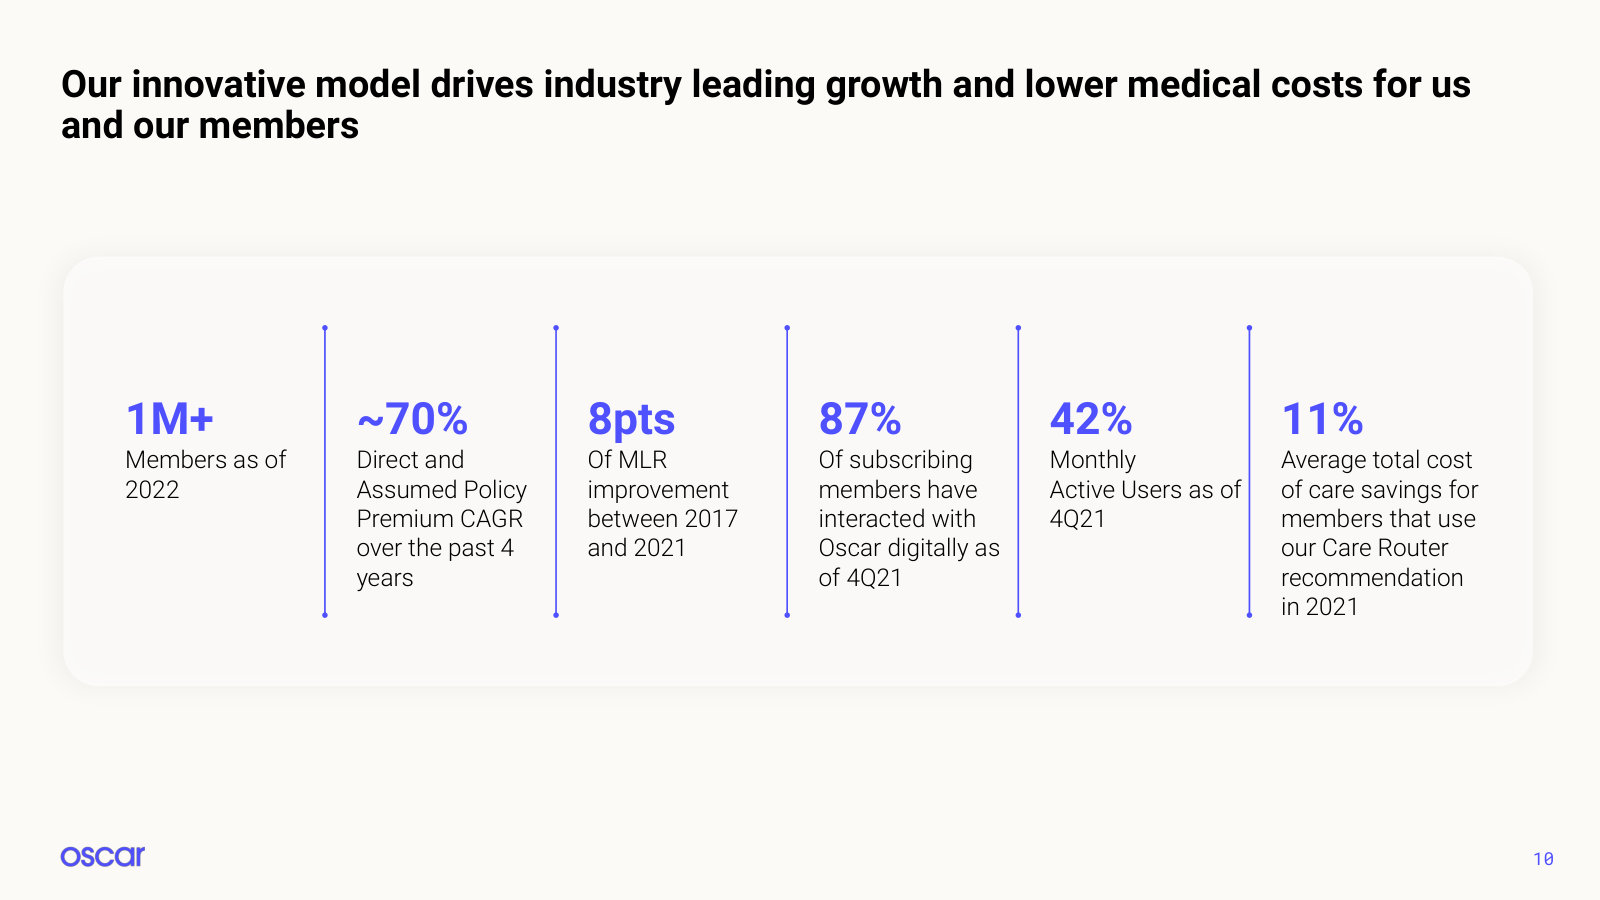
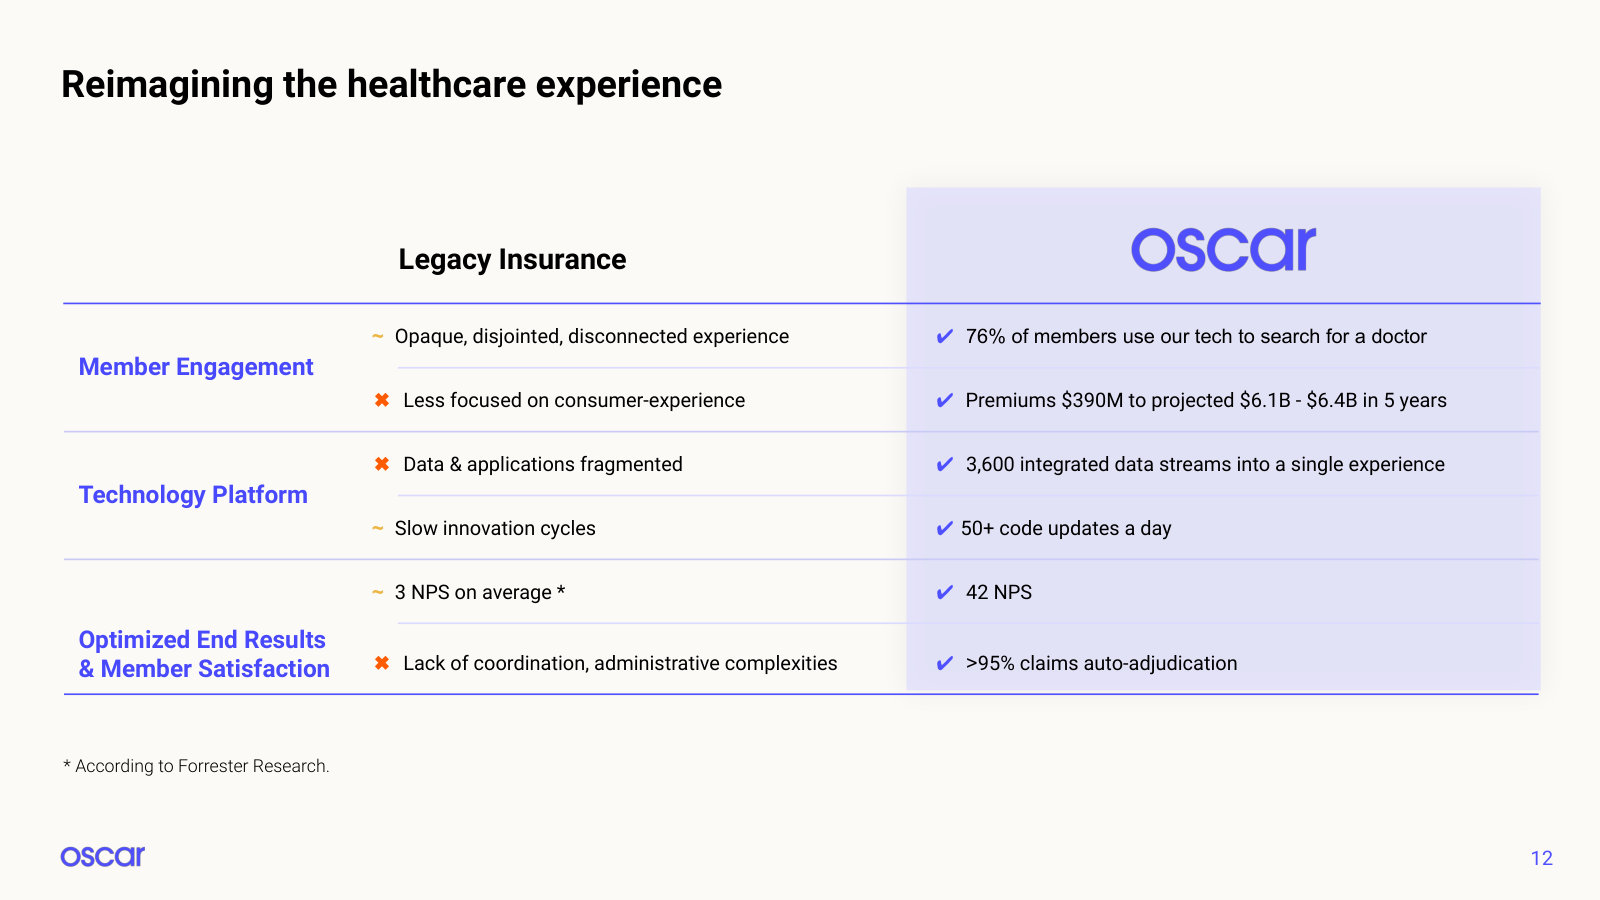
Investor Day 2022 — 2022
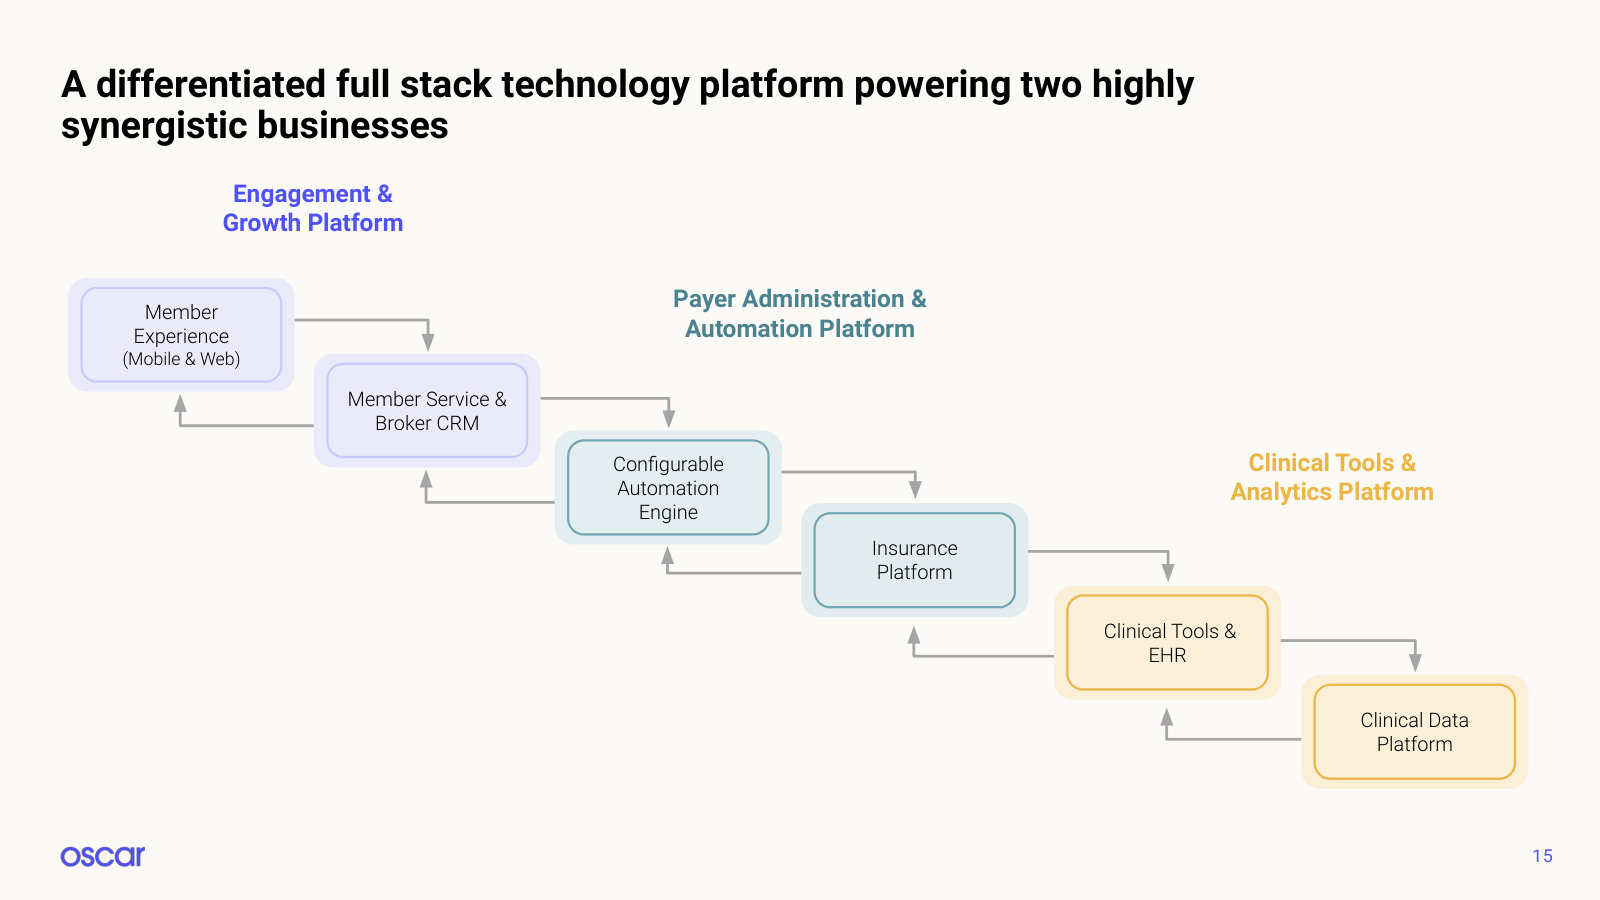
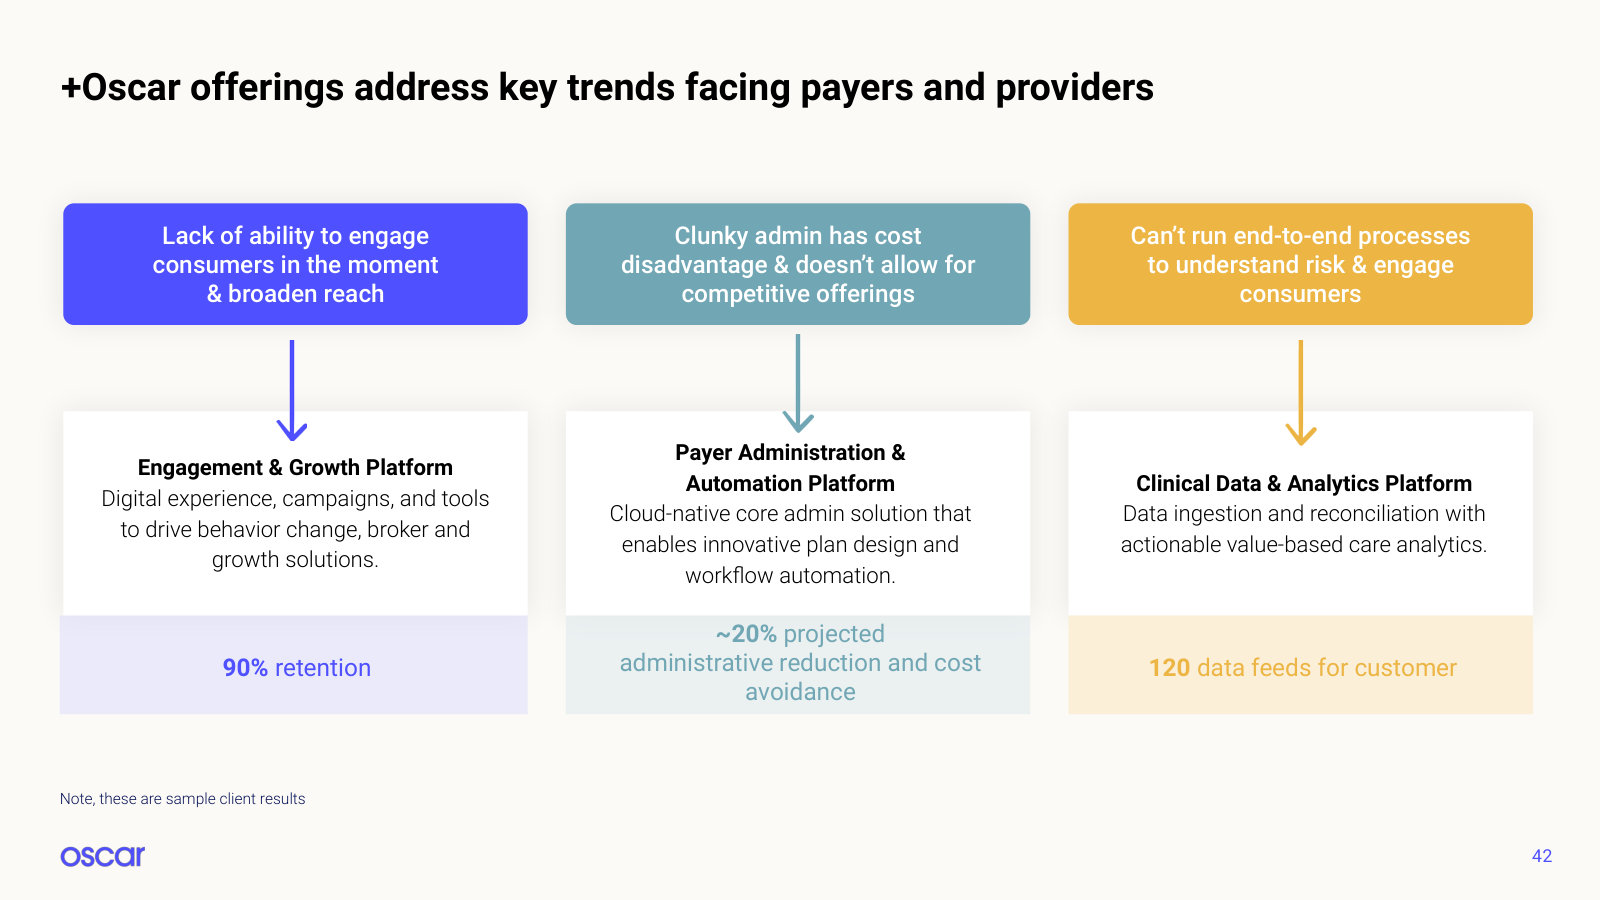
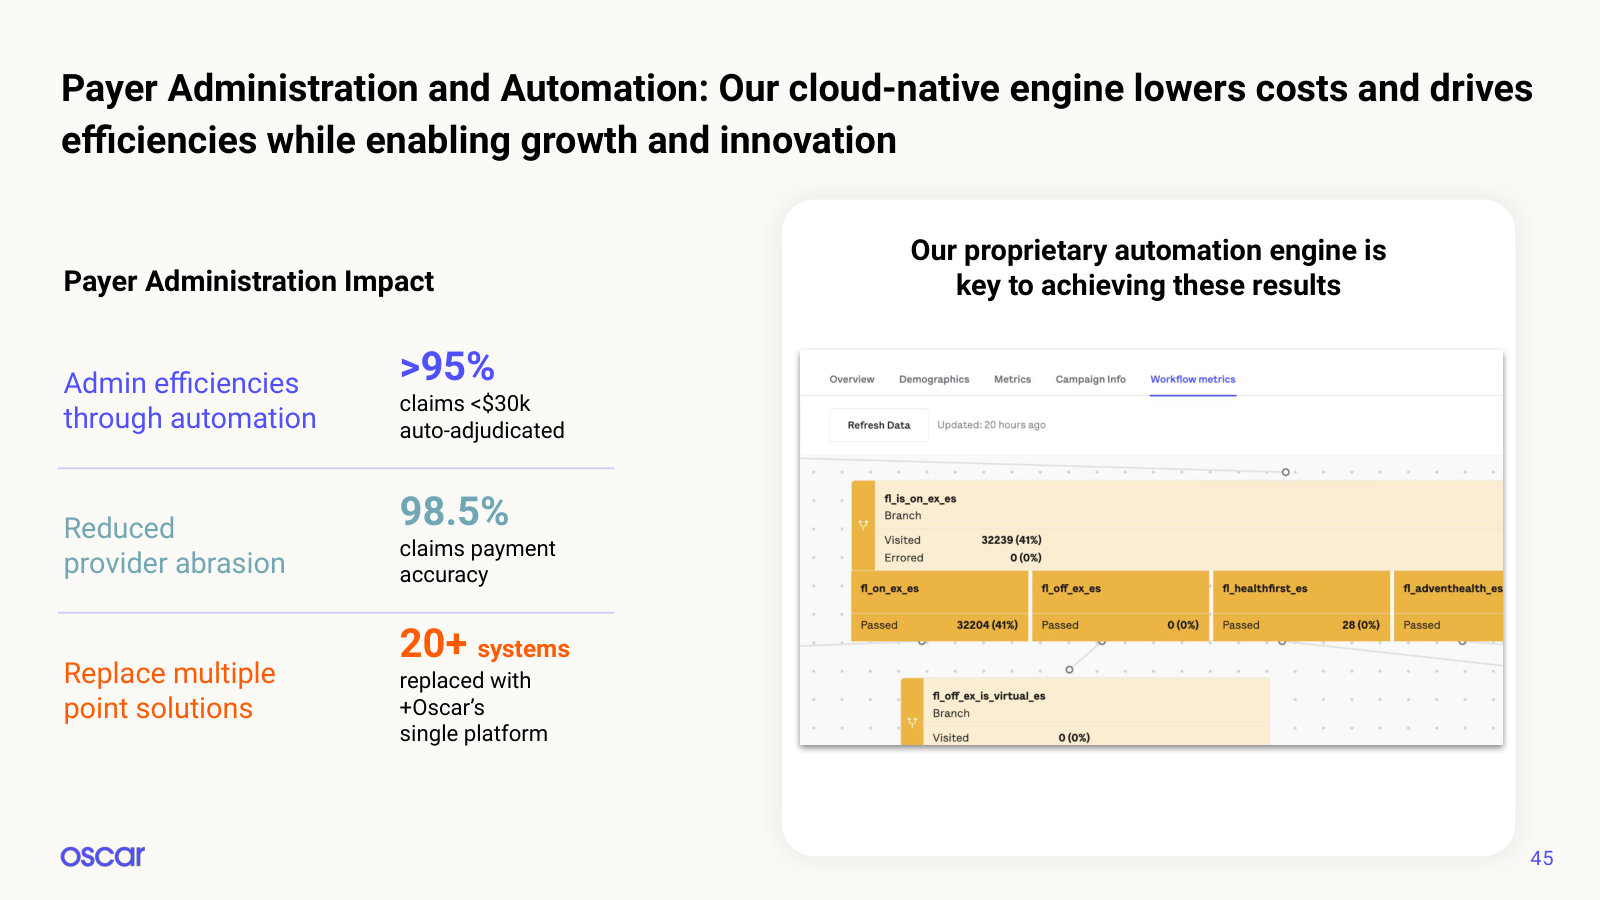
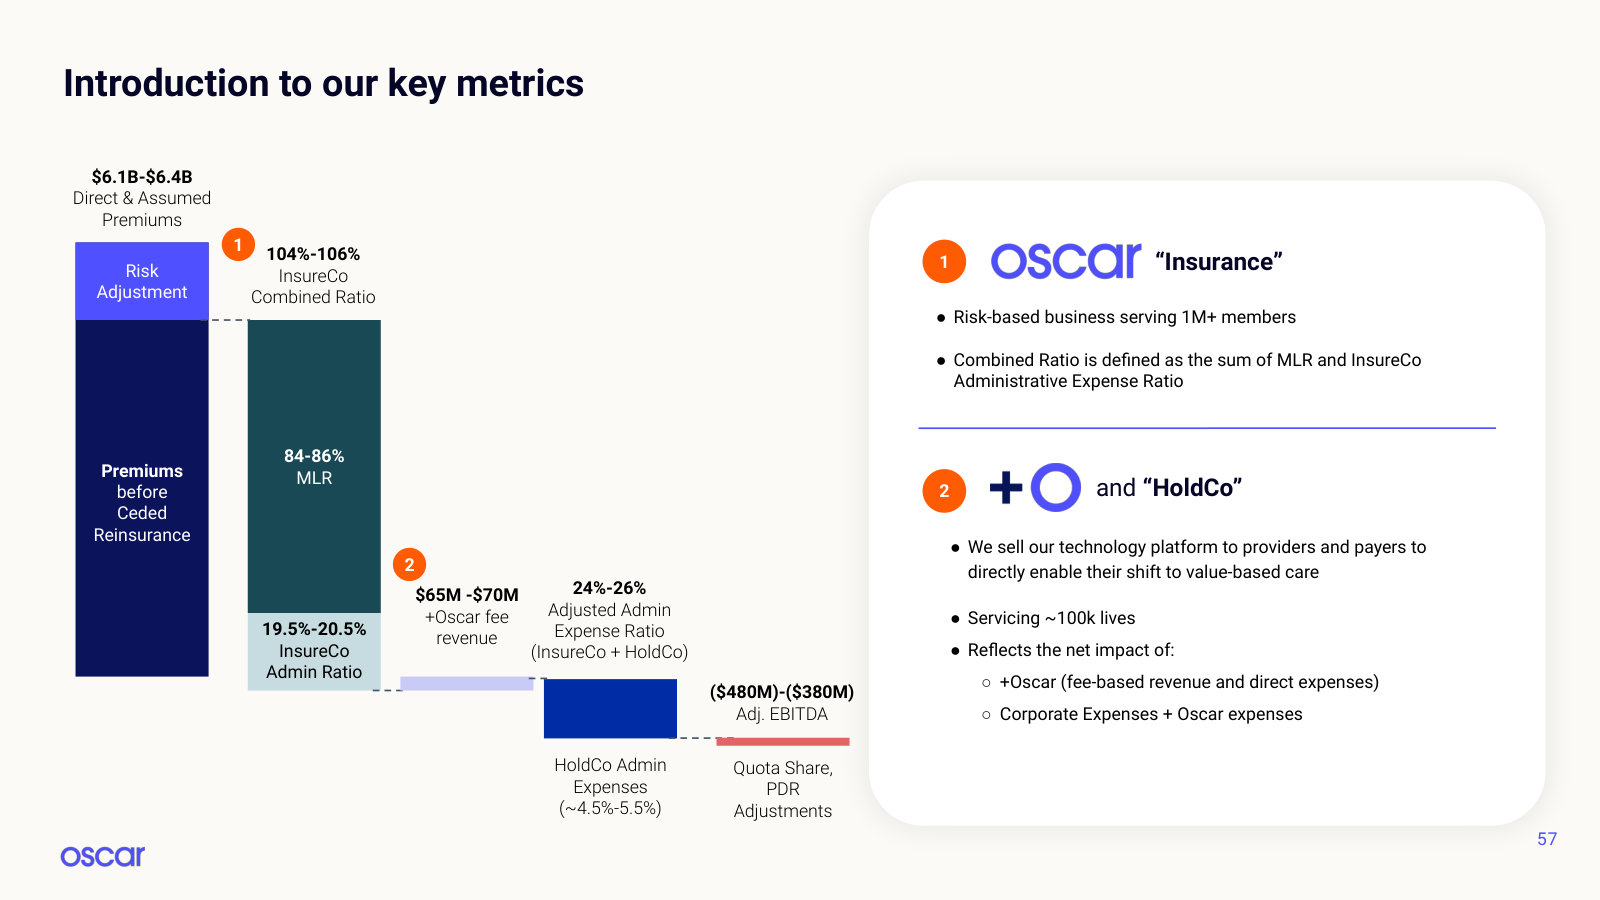
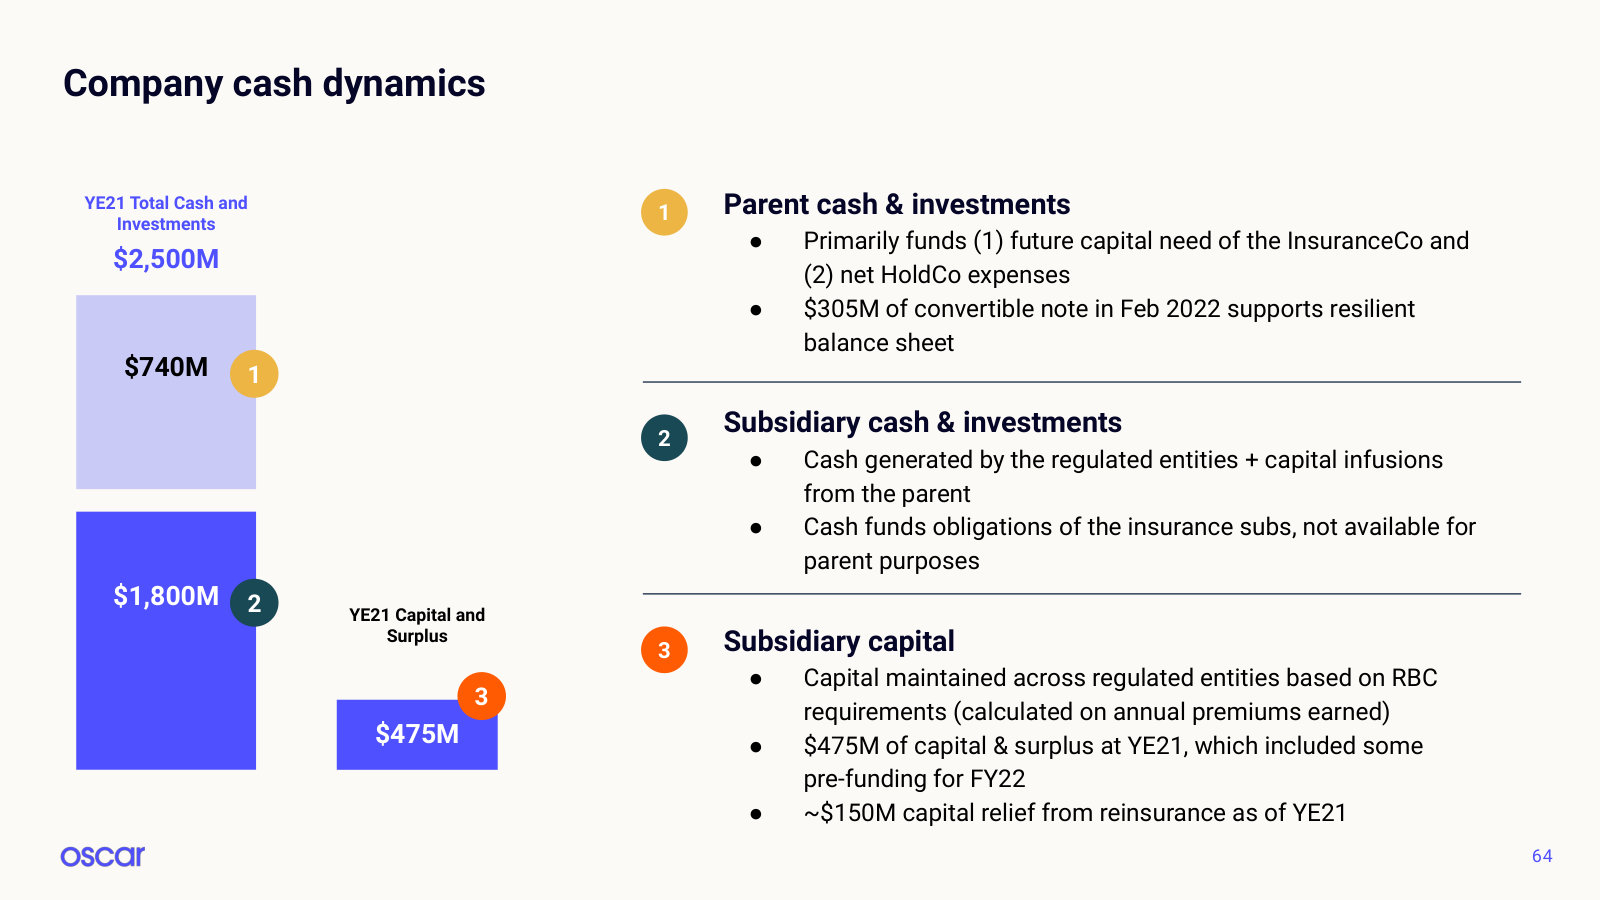
The earlier investor day, kept for what it explains and nothing since has: the P&L mechanics, the technology stack and +Oscar. · Open the full document →
More from management
J.P. Morgan Healthcare Conference 2024 — 2024 · 9 pages · The same story compressed into nine slides five months before the investor day, with a member-provider flywheel diagram. · Open →
Fourth Quarter and Full Year 2022 Earnings Presentation — FY2022 · 13 pages · The last full quarterly earnings deck Oscar published: FY2022 results and the original 2023 guidance. · Open →
J.P. Morgan Healthcare Conference 2023 — 2023 · 11 pages · How the path to profitability was framed entering 2023, under the prior CEO and before the ICHRA pivot. · Open →
Oscar Health, Inc.'s management answers for the business every quarter. These are the exchanges that explain it best — verbatim, from the call transcripts preserved in Sources. Each link opens the full transcript at that page in a new tab.
Q1 2026 Earnings Call — Q1 FY2026
The first quarter after the subsidy cliff, and the clearest current account of how risk adjustment, churn and the new marketplace business work. · Open the full transcript →
Why a seasonally light claims quarter mechanically inflates the risk adjustment accrual — the offset that drives Oscar's MLR.
Scott Blackley (Chief Financial Officer): I want to spend a moment on risk adjustment. Medical claims were seasonally low in the first quarter, and as a result, we recorded a higher risk adjustment accrual. It is early in the year, but we are encouraged by the data we are seeing on overall market contraction and market morbidity. Our claims experience, coupled with third-party data on both new and renewing members, points to market morbidity tracking in line to favorable to our pricing expectations. We continue to expect risk adjustment as a percentage of direct premiums to be approximately 20% in 2026 as new members engage with their benefits and members meet their annual deductibles.
p. 2 · Read in context →
The 200,000 members lost between February and April were mostly never-payers, so they brought almost no claims with them.
Jessica Tassan (Piper Sandler); Scott Blackley (Chief Financial Officer): I guess my first one is just can you describe the first quarter behavior of the 200,000 or so members who fell off between 1Q and April 1? I'm curious if they were pulling utilization forward into the base period or if they just kind of didn't utilize—were they not aware they had coverage? And then can you just describe the accounting for any expenses incurred by that population in your first quarter results? […] So I would say that for members who churned off, there was nothing unusual about any of the utilization patterns that we experienced in the first quarter. And those members, in general, the biggest portion of the drop-off really are people that never made a payment. And so we would not expect to see a significant amount of utilization for people that aren't paying. And once that person goes into a delinquent status, we no longer pay claims—you have to pay in advance in order to be covered. And so once you go into delinquency, we wouldn't expect to cover any claims that might be incurred. So really, everything that we saw in terms of member transition going from 3.4 million to 3.2 million and then starting the second quarter with 3 million members proceeded exactly as we expected.
p. 3 · Read in context →
Operating leverage is real — but 9% to 10% of premium is a fixed toll for being in the market at all.
John Ransom (Raymond James); Scott Blackley (Chief Financial Officer); Mark Bertolini (Chief Executive Officer): Just wanted to ask a question about SG&A. So your revenue was suppressed by almost 400 basis points by your risk adjustment versus the 20% guide, but your SG&A was 15.2%. Why would SG&A go up if presumably you're going to get a revenue lift for the rest of the year with a lower risk adjustment hit to revenue? […] I appreciate the question. We saw obviously strong revenue growth—revenue growing at 53% based on the headline numbers, higher than that if you normalize for the risk adjustment. SG&A grew at 46% in terms of SG&A dollars. So we are clearly seeing leverage coming through. I would say the first quarter SG&A ratio is likely to be the lowest for us during the course of the year. There's a little bit of a dynamic as we grow membership and have some open positions at the beginning of the year. There's a natural flow as we normalize the busines for the higher membership. So we'll see that kind of growth throughout the quarter. I woul think that from here, we'll probably see the SG&A ratio moving sideways to slightly up. The fourth quarter tends to be a little bit higher as we start to pick up expenses associated with open enrollment efforts. So I continue to think that there's a lot of opportunity to continue to drive performance and improvements in SG&A even at the low levels that we achieved in Q1. […] And I'd add, John, that taxes and fees are pretty much fixed for us based on the level of membership. It's 9% to 10%. So we're looking at the variable piece that we can manage versus that fixed piece, which is essentially a tax for being in the game.
p. 4 · Read in context →
A rare walk through the reserving judgement behind one quarter of prior-period development, adverse states included.
Jonathan Young (UBS); Scott Blackley (Chief Financial Officer): Just going back to the risk adjustment again. Would you say the risk adjustment was more a function of the claims data that you're seeing so far? And to be sure, there's no sweep or cleanup related to 2025 accruals within that? And then alongside that, did the Wakely data influence how you came to the 24% figure? […] Take those two things separately. The 24% risk adjustment level is explicitly being driven by our claims experience. Our risk adjustment reserves are still based on the market morbidity assumptions that we went into pricing with and that we set our guidance with. We have not made any adjustments for some of the favorability that we see in the Wakely market morbidity report, so again, that could be a tailwind, but we're waiting to see more signals before we lean into that. On prior period development (PPD), in the last weekly report we received for 2025, we did see a couple of states that had adverse development totaling about $85 million. We reflected that in the quarter. We did have some other states with positive developments, which we chose not to recognize and instead wait for the final report. So we feel like we balanced the risk in that area. We also had favorable claims run out to a significant degree of $150 million. Net-net, our prior period development was favorable $68 million in the quarter. When I look at the combination of those factors, favorable prior period development is helpful, and we used those risk levels and reserve levels in building our pricing for 2026. We think those tailwinds will transition beneficially over the year.
p. 6 · Read in context →
The economics of the new Lucie marketplace: higher margin per dollar than an insured member, and no risk capital behind it.
Olivia Miles (Baird); Mark Bertolini (Chief Executive Officer); Scott Blackley (Chief Financial Officer): I'll give some headlines now and go into more depth at Investor Day in September. As we talk to employers around the country, including increasingly larger employers interested in ICHRA solutions, they care a lot about networks. While an individual shopper wants to select their network, we're inviting competitors to the platform because an individual can select among different plans. That matters because you're converting an entire employer. On the economics, converting to an employer solution means you have to meet other benefit solutions. We have companies like Allstate Health and Aflac and Guardian joining our platform to provide ancillary products. More importantly, the margin from a dollar standpoint for these employer relationships is higher than an insured ACA member and it's unregulated in that it doesn't require risk capital. It's another margin opportunity to grow both top and bottom line over time. We're excited about the model and are assembling it, and having many partners on the platform allows us to share networks and offer narrow network rates that are very competitive given combined purchasing power. We'll provide more detail in September. […] Any of the costs to stand up that business are included in our guidance. For this year, we would expect a modest effect, but we're excited about the prospects of building a fast growing, high-margin business.
p. 7 · Read in context →
How Oscar took share in the 2026 enrollment: brokers pre-loaded with member lists and mapped replacement plans.
Raj Kumar (Stephens); Mark Bertolini (Chief Executive Officer): I'd explain that by distribution. It's hard to know exactly where all new members came from, but we did pick up some auto-assigned members from a competitor that left the marketplace. When we did our Investor Day two years ago, we assumed there would be no enhanced subsidy extension and built our plan accordingly. That allowed us to prepare products that would mitigate cost increases for members, and we built tools that allow brokers to set aside what they needed to retain members. For brokers, it's about maximizing capacity to sell and retain. We gave them products and lists of members and product recommendations. Many competitors were stuck between expectation of enhanced subsidies or not and didn't make the plays we made on product. Brokers, seeing our solutions, brought members to us. Our enrollment growth was almost a straight line up over the first three to four weeks when enrollment opened because our brokers were ready, had already talked to clients using our technology, and were able to get them signed up efficiently.
p. 8 · Read in context →
Metal mix is not what drives risk transfer — the formula adjusts for it. Total utilization is what matters.
Craig Jones (Bank of America); Scott Blackley (Chief Financial Officer): So I think your member mix, when you think about the Bronze members, I think it went from a little below average in 2025 to now a little above average in 2026 versus the market. With that mix shift toward Bronze versus average, how does that impact your risk adjustment payable year-over-year? […] Our book is relatively balanced: Bronze is our largest category, Silver close second, Gold a significant portion as well. The risk adjustment formula is intended to be neutral across metal levels: coefficients in the formula adjust for the expected claims and condition values of different metal tiers. So risk adjustment isn't driven entirely by metal mix. What's more important is overall utilization across metals. We tend to attract relatively healthier members given the products and markets we're in—urban areas that skew healthier on average. We do think you see healthier members in Bronze than in Silver, for example, but across all metals we expect strong margin performance and view risk adjustment as more driven by overall utilization than any one metal.
p. 8 · Read in context →
Q4 and Full Year 2025 Earnings Call — Q4 FY2025
The reset-year post-mortem and the 2026 rebuild: how the book was repriced, what growth costs in capital, and what management still could not predict. · Open the full transcript →
The 2026 rebuild in one passage — price to the high end of expected contraction, refile rates across 99% of the book.
Scott Blackley (Chief Financial Officer): Our disciplined pricing assumed and expected market contraction at the high end of our previously communicated 20% to 30% range driven by the expiration of enhanced premium tax credits and CMS program integrity initiatives. We also refiled rates in states covering approximately 99% of our membership to reflect the higher market morbidity in 2025. Together, these actions position us to profitably drive share growth. For 2026, we expect total revenues to be in the range of $18.7 billion to $19 billion, an increase of 61% year-over-year at the midpoint, driven by another year of above market growth during open enrollment, solid retention, and rate increases. While our weighted average rate increase for 2026 was approximately 28%, the increase on a per member per month basis is lower, reflecting shifts in member age and metal mix.
p. 3 · Read in context →
The rule of thumb that governs how fast Oscar can grow: roughly $50 million of capital per $1 billion of premium.
Scott Blackley (Chief Financial Officer): To help frame our capital position in the context of our growth outlook, I want to spend a moment on regulatory capital requirements. While individual states vary, a useful rule of thumb is that for every $1 billion of premiums, we are required to hold approximately $50 million of capital, which reflects roughly 55% quota share reinsurance ceding percentage for 2026.
p. 4 · Read in context →
The hardest question on the call — who pays a first premium and then quits? — answered with candid uncertainty.
John Ransom (Raymond James); Mark Bertolini (Chief Executive Officer); Scott Blackley (Chief Financial Officer): I have a basic question that might not reflect well on my intelligence. I understand passive enrollment, but you need to pay the first premium to be covered. So, what type of member gets passively renewed, pays the first premium, and then chooses to drop off? […] That is the key question this year in comparison to previous years. Typically, once customers begin paying a premium, they remain with us unless an event occurs that makes them no longer need our coverage. However, in the current situation, as they assess the out-of-pocket expenses related to their plans, they may realize that it's too costly and unaffordable. An important change is that most Americans now view healthcare as the largest expense in their household budgets, even more significant than their mortgages. This has led many customers to fear losing their homes or facing bankruptcy without coverage. The pivotal question is what happens if they cannot afford the deductible and how we will address that issue. We're examining whether this situation will drive enrollment or if people will remain enrolled out of fear of losing their homes or facing financial hardship. We're uncertain, so we are cautious about predicting the degree of disenrollment that may happen as a result. […] John, just to add one more dimension there. When you look at our expectation and what we'r seeing on payment rates, if you're going from having an out-of-pocket premium that you wer paying in 2025 to having an out-of-pocket premium that you're paying to '26. And you have actively enrolled and even passively enrolled. We're seeing relatively strong payment rates in those categories. It's really the population where you're going from a $0 plan to something that you've got to pay out of pocket. So you've either lost your subsidy or you've transitioned from one plan to another. That's where we expect to see really high nonpayment rates. And the way the whole process works, you may not make your first payment in January, but you don't ultimately churn off until the end of the quarter because you are in a grace period until then.
p. 8 · Read in context →
The metal shift quantified — silver roughly halved, gold up several-fold — and why premium per member lags the headline rate increase.
Stephen Baxter (Wells Fargo); Mark Bertolini (Chief Executive Officer); Scott Blackley (Chief Financial Officer): Sure. For Bronze, the percentages for the past two years were around 25% and 26%, and now they are at 39%. Silver has remained steady at 71% over the last two years, and this year it’s at 36%. Gold, which was in the low single digits at 3% or 4% for the last two years, has now risen to 25%. There are fairly significant changes. The bronze and gold plans we offered were $0 with benefits that are not very rich. […] Stephen, the other thing I would just mention is that the characteristics of the membership are important to modeling your revenue. So the fact that we're seeing a year younger membership has an impact on PMPM revenue. So you need to factor that in. That's one of the reasons why I discussed that in the call is to help with your ability to project revenue with that information.
p. 9 · Read in context →
The CFO names risk adjustment the hardest estimate he makes each quarter, because no single carrier can see the market.
Olivia Miles (Baird); Scott Blackley (Chief Financial Officer): Because exchange marketplace risk adjustment is net neutral, creating a reliance on other plans in our markets, the lack of visibility any one plan has into the rest of the market makes risk adjustment mechanics difficult in our view. Looking to 2026 and beyond, you mentioned the potential Wakely industry report in 1Q, whether it's through this potential Wakely report or other efforts, can you share how you're getting more insight into the rest of the market as well as your thoughts on what can be done to make risk adjustment more transparent and less volatile in the future? Is there any potential reform you think could be done to improve risk adjustment? […] Thank you for the question, Olivia. Estimating risk adjustment is indeed the most challenging task we face each quarter, as it involves projecting our own performance as well as market trends. While we are confident in our ability to forecast our own book's performance, we often encounter surprises due to unexpected market movements. I am hopeful that by collaborating with Wakeley, which many of us in the industry are using as a key service provider, we can gain more timely insights into the market. This is crucial for improving our projections. We are making progress in this area, and while we may not achieve complete clarity in the first report, I believe that with support from various industry players, we can enhance visibility on these estimates over time.
p. 10 · Read in context →
Where ICHRA is meant to lead: a second revenue line from converting employers to defined contribution, without risk capital.
Mark Bertolini (Chief Executive Officer): From a micro perspective, we are focusing not only on products to capture membership within the insurance company, but we've also developed the front end of the business to engage with employers and convert them. There are significant revenue opportunities, particularly in higher-margin areas that do not require risk capital, by assisting employers to transition employees into defined contribution plans. Once employees are in defined contribution, we can collaborate with brokers to direct them to suitable plans, whether they are Oscar plans or not. Over time, you will see us reporting two types of revenue: one from the conversion of employers to defined contribution and the associated brokerage work, and the other from membership within our health plan. The ICRA opportunity is much broader than just membership, though our membership doubled this year. Due to recent events in the individual market regarding rates, some employers have been hesitant to participate at this time. We need to demonstrate that we can stabilize the marketplace and attract more members. This outlines the current situation regarding ICRA.
p. 11 · Read in context →
Q3 2025 Earnings Call — Q3 FY2025
The pricing-cycle call: a 28% weighted average rate increase, where it left Oscar competitively, and the plainest statement of what it actually underwrites. · Open the full transcript →
Who the individual-market customer is, and what the enhanced subsidy is worth to them in dollars per month.
Mark Bertolini (Chief Executive Officer): The individual market is the only source of affordable health coverage for 22 million Americans who power our economy. The majority of members are from the small businesses, service, and farming sectors, which together generate nearly half of U.S. GDP. These hardworking people do not have access to employer coverage and rely on enhanced premium tax credits to fill the gap. For example, the average farmer making $60,000 a year now pays $75 a month for health insurance compared to $300 a month before the enhanced premium tax credits. That $225 is the difference between paying for health care or paying the bills. Limiting access to affordable coverage in the individual market undermines Main Street and rural America.
p. 1 · Read in context →
How the 2026 price was stacked, and the claim that underlying MLR ex-morbidity was still near the original guide.
Jessica Tassan (Piper Sandler); Mark Bertolini (Chief Executive Officer); Scott Blackley (Chief Financial Officer): Got it. And then just maybe do you have any early thoughts on how Oscar's morbidity in 2026 might evolve relative to the market? Or maybe just anything in your pricing or product design or commercial strategy that you'd call out that would give you maybe more control over your morbidity relative to the market? […] Well, on the first point, we have priced as if premium tax credits are gone. The '25 impact of morbidity, '26 potential impacts on morbidity given the shrinkage of the market, which we think is anywhere between 20% and 30%. 20% is the lower end without a number of these things, 30% being the highest, but that has an impact on our morbidity and program integrity efforts as if they were implemented. And we stack those in our pricing. We did not look for any duplication. And so we believe we're well-covered depending on whatever happens next year relative to the morbidity in the market. Anything to add on that, Scott? […] No. And I think it's too early to say much about '26 morbidity. I think that when I look at the core performance of the company this year and I strip out kind of what happened with the impacts of market morbidity shifting higher this year, we're really pleased with the underlying trends, right? We're seeing an MLR when I strip out kind of the impact of what was happening with market morbidity, the underlying MLR is pretty consistent with the guidance that we gave at the beginning of the year in the low 81% range. And so when I step back from that and look at the dynamics in the company, our ability to influence what's going on with our medical expenses, we feel like we're really well positioned to continue to navigate this marketplace. And as Mark talked about, we feel like our pricing captures the risk. We feel like the company is getting ever better at delivering our services. So we feel really well positioned for '26.
p. 6 · Read in context →
Competitive position made concrete: lowest or second-lowest silver in 15% of markets in 2025, 30% in 2026.
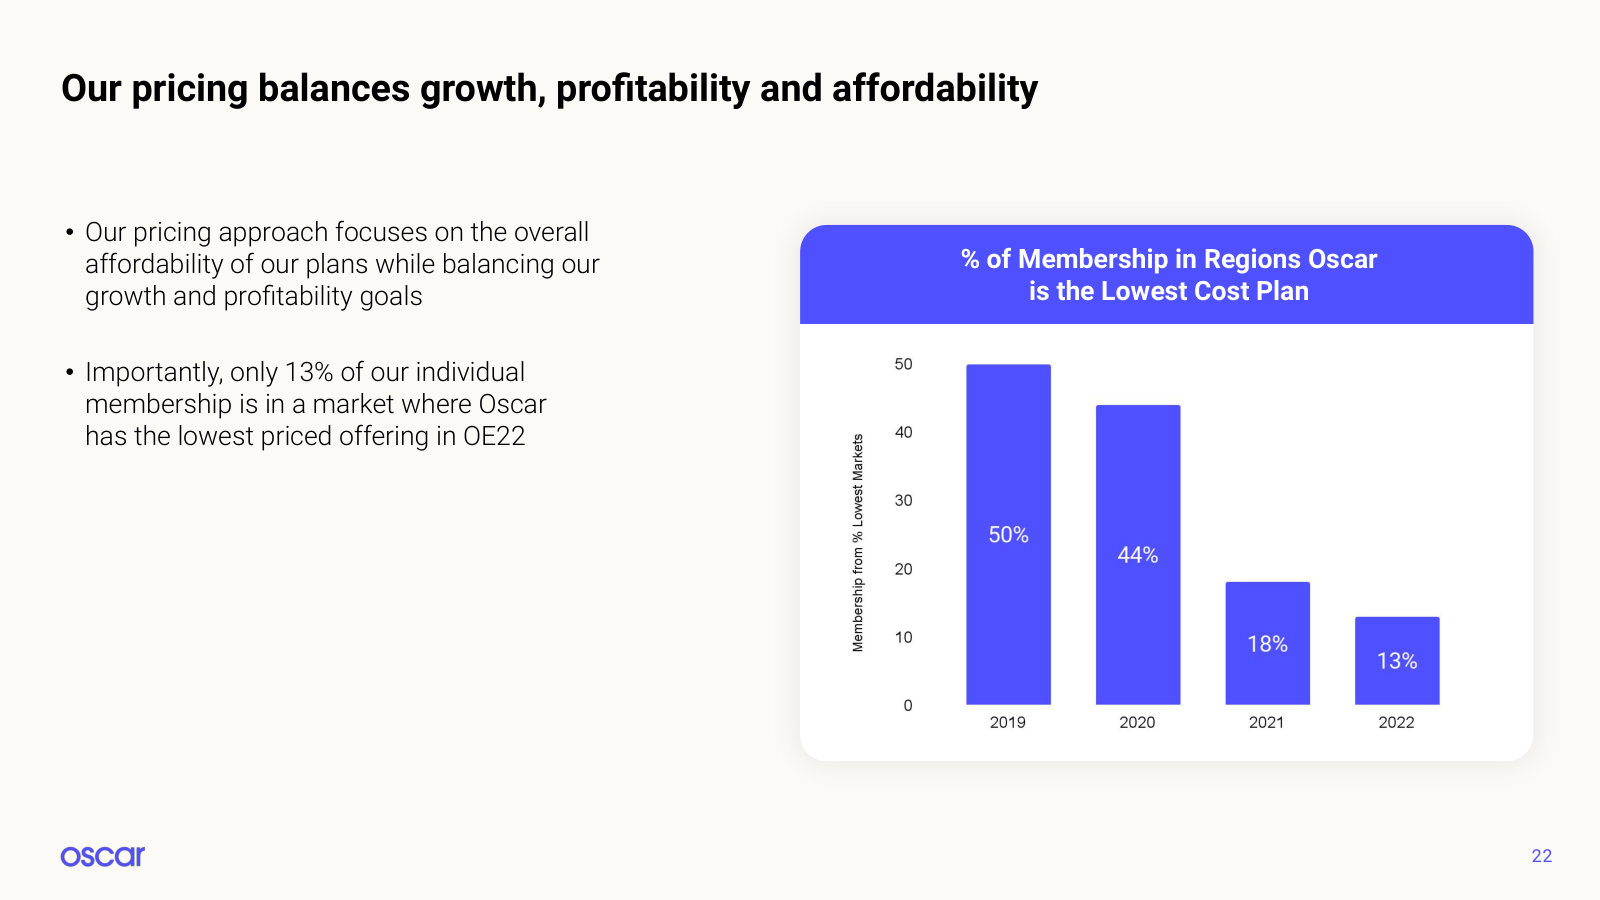
Stephen Baxter (Wells Fargo); Scott Blackley (Chief Financial Officer): I guess the first question would just be trying to dive into the competitive dynamics a little bit more for next year. It seems like maybe some of your large peers have rate increases that are at or maybe above your 28%, but then maybe some of the not-for-profits could be a little bit lower. Just to kind of boil it down, like is there any kind of metric you have where you kind of have an analysis of what percentage of your markets you're going to be in a low-cost position, either just in the silver market or maybe across all your markets and how that compares to 2025? […] Steve, so when we think about competitive position relative to last year, first of all, all these increases in prices, you've got to start with last year's price position where last year, we were only, I think, in 15% of our markets, we were the lowest or second lowest silver price plan. This year, that's moving up to 30%. We still think that, that's less than some of the other large competitors that we see in the marketplace. So while we're competitive, we're not as competitive as some others. When I think about that relative price position, we think we can grab share in several of these markets. We think that the average price increase nationally is around 26% based on research by the Kaiser Family Foundation. So we think that we've done a nice job of putting our pricing into the market in a way which is competitive, allows us to grow margin, but also is disciplined and allows us to protect ourselves as well.
p. 7 · Read in context →
Asked why grabbing share into a shock is right, Bertolini explains Oscar underwrites the network, not the member.
Andrew Mok (Barclays); Mark Bertolini (Chief Executive Officer); Scott Blackley (Chief Financial Officer): You mentioned that your competitive pricing was in line with expectations and that you expect to take market share next year. Can you help us understand that strategy a bit more? Why is taking market share the right strategy in 2026? And do you think that is more likely or less likely to hurt from an adverse selection standpoint? […] Taking market share involves capitalizing on competitors who have priced themselves out of the market. There is an important distinction between the group market and the individual market that I hope is clear. Due to the risk adjustment system and its mechanics, underwriting members in the network is nearly impossible or simply not worth the effort. Our focus is on the provider network itself and how we underwrite that network. Some of our competitors, who have set much higher prices or exited the market, are relying on commercial networks at those elevated prices, while we have consistently utilized narrower networks. In the individual buying process, consumers have the freedom to choose a network and plan design that best suits their needs, instead of receiving a costly broad network plan from their employer that may not adequately meet anyone's specific requirements. Consequently, we see a chance to capture market share from those pricing themselves 30% to 40% higher than us, integrating those consumers into our networks and underwriting strategies to enhance our effectiveness. Our pricing strategy reflects the actual costs of the network, as we benefit from the risk adjustment aspect. […] I want to reinforce what Mark mentioned earlier. We see clear indications of a very rational marketplace. We don't believe anyone has attempted a land grab by significantly lowering prices. We think we're positioned appropriately within the market. Therefore, from an adverse selection standpoint, that isn't a major concern for us.
p. 9 · Read in context →
On the marketplace-fraud debate: Oscar's own dual-eligible exposure came in at low double-digit thousands, not millions.
Mark Bertolini (Chief Executive Officer): And one more thing I'll add is that we are very supportive of the program integrity efforts and the things that happened this year in program integrity had less and less impact on us as an organization than others because we spend a lot of time validating as much as we can the membership that comes into our plan. And if we see what we see as potential fraud, we sideline those brokers and those members and evaluate whether or not it's appropriate to bring them on board. So given that, when we received our dual eligible information, it was low double-digit thousands, very low double-digit thousands versus the headline report put out by certain people in the press of 2.4 million people. And so the obvious impact to us was a lot less than we thought it was going to be because we had done the homework upfront. We think this is a key part of making sure risk adjustment works well is that everybody uses these same tools to make sure that the people we're bringing on board belong on board, not because somebody else was able to get commission.
p. 10 · Read in context →
Q2 2025 Earnings Call — Q2 FY2025
The quarter the thesis was tested: a $316 million risk adjustment true-up, a swing to a full-year loss, and the first defence of the balance sheet. · Open the full transcript →
The diagnosis of the shock: sicker entrants from Medicaid redeterminations, healthy low-utilizers leaving on program integrity.
Mark Bertolini (Chief Executive Officer): Let's start with recent market dynamics. The latest risk adjustment data from Wakeley, which includes claims data through April 30, indicates a meaningful market-wide increase in morbidity in 2025. This morbidity shift is impacting all carriers, increasing by mid- to high single digits across Oscar's markets. We attribute market morbidity increases to consumers entering the individual market for Medicaid redeterminations and healthier, low-utilizing consumers leaving the market in part due to program integrity efforts.
p. 1 · Read in context →
Where the marketplace strategy starts: a brokerage, a CMS-approved enrollment platform and the first branded ICHRA plan.
Mark Bertolini (Chief Executive Officer): We are announcing several strategic steps to power ICHRA and further diversify our business. We acquired important early-stage assets with capabilities to help us build the consumer marketplace of the future. These assets include an individual market brokerage, a direct enrollment technology platform, and a consumer education website, healthinsurance.org. We are also launching a new ICHRA product with a well-known consumer brand in the Midwest, Hy-Vee, Inc. Our new ICHRA assets will give us capabilities to meet and exceed the expectations of consumers and employers. The technology platform, INSXCloud, is a fundamental asset of the marketplace as it is one of only 11 CMS-approved solutions, creating a digital storefront for all health products. The brokerage, IHC Specialty Benefits, offers individual medical and supplemental health products across carriers in all 50 states. The brokerage will allow us to offer consumers the supplemental health products they typically buy with health insurance. While the acquisition will not have a meaningful impact on our near-term results, we believe these capabilities are important building blocks of our long-term strategy. Hy-Vee is one of the most trusted brands in the nation with 570 grocery and convenience stores and 270 retail pharmacies. Hy-Vee and Oscar are introducing a new Hy-Vee Health branded ICHRA plan. We are initially launching this product for employers and employees in Des Moines, Iowa, for plan year 2026, subject to state approval. The plan offers superior benefits, including concierge medicine at an affordable fixed price through Hy-Vee Health Exemplar Care clinics. Our partnership is an example of the innovation we intend to drive with other employers, provider systems, and consumer brands in the United States.
p. 1 · Read in context →
Restating the first half on a consistent accrual shows how much of the damage was timing rather than claims.
Scott Blackley (Chief Financial Officer): The second quarter MLR was impacted by an incremental $316 million increase to our risk adjustment payable for 2025, driven by higher ACA marketplace morbidity that increased by more than our prior estimates. We recognized the year-to-date impact of the risk adjustment change in the second quarter. Applying the revised risk transfer accrual consistently across the first half would have resulted in an MLR of 80.7% in the first quarter and 85.1% MLR in the second quarter.
p. 3 · Read in context →
Can the balance sheet absorb the loss? The answer separates subsidiary excess capital from parent cash.
Joshua Raskin (Nephron Research); Scott Blackley (Chief Financial Officer): Yes. Well, Josh, let me start with your question about cash. So as we talked about in the prepared remarks, we feel like we've got a very strong capital position at this point, $5.4 billion of total cash and investments, $579 million in excess capital and $205 million of cash at the parent. The vast majority of the cash and investments are in our insurance subsidiaries, which more than covers the risk adjustment payable as well as our required capital, and that's where you end up with the excess capital. We think that the bulk of the remaining losses that we're forecasting for this year are going to be absorbed by that excess capital position. And so you saw that our excess capital decreased by about $300 million from last quarter, and that was the subsidiaries absorbing the losses in the second quarter. And with respect to parent cash then, I do think that parent cash will decline in the back half of the year, largely due to us making some additional capital contribution to the insurance subsidiaries where we don't have as much excess capital. But we feel confident that parent cash is going to be at levels that remain more than sufficient to cover the cost of the holding company and the things that we need. So we feel really good about where our capital position was going into this change in market morbidity and are confident that we've got the access to funding that we need to continue to run this company.
p. 4 · Read in context →
Pressed on the 2027 targets in the middle of the shock, Bertolini declines to withdraw them.
Joshua Raskin (Nephron Research); Mark Bertolini (Chief Executive Officer): How should we be thinking about your previous long-term targets for 2027, specifically the 5% margin and the $2.25 of EPS? […] Well, we're not changing our longer-term forecast at this moment, but 5% is still our target. We need to get through this pricing season, see how the membership is going to develop as we then look at '26, '27, and '28, we'll revise as necessary. But at this point in time, we're not changing our point of view.
p. 4 · Read in context →
Q4 and Full Year 2024 Earnings Call — Q4 FY2024
The high-water mark: first profitable year, the 2027 margin target, and the definitions — effectuated versus paid, price versus trend — a reader needs to follow everything after. · Open the full transcript →
The first profitable year, and the long-term frame every quarter since has been measured against.
Mark Bertolini (Chief Executive Officer): This afternoon Oscar reported the strongest year of financial performance in our history. Our results were driven by record high membership, bottom line profitability, and continued product innovation. Oscar reached two significant milestones in 2024. First, we reported total company adjusted EBITDA profitability growing to $199 million, a $245 million year-over-year improvement. Second, we achieved net income profitability. Net income was $25 million, a $296 million increase over the prior year. Our improved bottom line was driven by strong performance in all parts of our business. We grew total revenue by 57% year-over-year to $9.2 billion. Our medical loss ratio was stable year-over-year increasing 10 basis points to 81.7%. We also drove greater efficiency in our business as our SG&A ratio improved more than 500 basis points year-over year to 19.1% through operating leverage and disciplined expense management. Our 2024 performance reflects the strength of our strategic plan and our ability to deliver long-term profitable growth. Overall, 2024 was an exceptional year for Oscar. Our results reflect our growing maturity as a company and we are committed to delivering at least 20% revenue CAGR and a 5% operating margin by 2027.
p. 1 · Read in context →
A year before the shock, a Q4 MLR miss is already attributed to market risk scores rather than utilization.
Josh Raskin (Nephron Research); Mark Bertolini (Chief Executive Officer); Scott Blackley (Chief Financial Officer): Just I’ll start with one point that I think is really important to understand. Our utilization came in as expected actually slightly better. So what you’re seeing in the change of the MLR is not worsening utilization, it’s the relative risk of our book versus others and the impact of risk adjustment settlements at the end of the year. […] So, I think that on the MLR, I’ll start there. So for MLR, as Mark just talked about, what we have seen is utilization actually came in slightly favorable to what we would have anticipated. And we saw risk or development proceeding as we would have anticipated based on the claims that we’ve had. And when we got the fourth quarter risk report from our friends at Wakely, we observed that in several markets there had been an increase in the risk scores of the market versus what we were expecting. So we took that information and updated our accruals for that. So that is really what drove the pressure in MLR. It also, as a result, when you increase your risk transfer, it also drove a shortfall in revenue. So it was the same thing driving both those effects. I would also point out that we had favorable prior period development in the fourth quarter, which offset some of the pressure from the risk adjustment true-up. And those same drivers had an effect on the full year MLR, but to a lesser degree.
p. 5 · Read in context →
How margin is constructed: price the trend, then earn the spread with affordability initiatives.
Jessica Tassan (Piper Sandler); Scott Blackley (Chief Financial Officer): Yes. Well, I would say that, first off, we always take an approach to pricing, which is we want to have a disciplined pricing strategy that balances our desire to both grow the book and to create margin for us, so that's kind of thing one. When we think about the different pricing for each of the metal tiers, we do that primarily with the view of we want all of our book to perform in a way that creates margin for the business, so that's probably the most important lens. So, we build up what do we think the trend is going to be and then we create margin by basically having affordability initiatives that allow us to experience an MLR that is below the or experience an increase in medical costs that is below the trend, so that's kind of what we do there.
p. 8 · Read in context →
What a $0-premium member is actually buying — catastrophic protection, not care.
Mark Bertolini (Chief Executive Officer): What we have found in a number of our zero premium plans, there are a large number of members that don't use care at all that significantly. And that's largely as an insurance policy for them in case there's an accident or someone gets ill; they don't lose the house. So it's a very different purchasing decision. They're buying a plan at zero premium that gives them some coverage for catastrophic events.
p. 8 · Read in context →
More calls
Q1 2025 Earnings Call — Q1 FY2025 · 8 pages · The last clean quarter before the reset, and the one place management decomposes the record 15.8% SG&A ratio into fixed leverage, variable savings and exchange fees. · Open →
Q3 2024 Earnings Call — Q3 FY2024 · 8 pages · The 2025 pricing cycle in a calm market — roughly a 6% rate increase against a 7% market — the baseline against which the 28% increase for 2026 should be read. · Open →
Q2 2024 Earnings Call — Q2 FY2024 · 7 pages · The first quarter reported against the June 2024 Investor Day plan, including the SEP-membership economics that carried 2024 growth into 2025. · Open →
Q1 2024 Earnings Call — Q1 FY2024 · 7 pages · The pruning that made Oscar a pure individual-market bet: exits from Medicare Advantage and the Cigna+Oscar small-group venture, with ICHRA named as the replacement. · Open →
Q4 and Full Year 2023 Earnings Call — Q4 FY2023 · 9 pages · Bertolini's three-priority turnaround framework and the 2023 insurance-company EBITDA milestone — the starting point of the profitability story. · Open →
Q3 2023 Earnings Call — Q3 FY2023 · 7 pages · The path to 2024 total-company profitability set out mid-turnaround, plus the county-level expansion logic behind the 2024 growth. · Open →
Q2 2023 Earnings Call — Q2 FY2023 · 11 pages · Bertolini four months into the job, with Sid Sankaran still CFO, giving his first read on what he found inside the business. · Open →
Oscar Health, Inc.'s annual reports contain management's most considered account of the business. These are the sections, passages and visual pages worth opening in the originals preserved in Sources.
Oscar Health, Inc. — FY2025 Annual Report (Form 10-K) — FY2025 (year ended December 31, 2025)
The latest 10-K: 2.0m members, $11.7bn revenue, a $443m net loss, MLR 81.7%→87.4%, and a $2.53bn net risk adjustment payable. · Open the full document →
Item 1. Business — Our Business and Our Offerings — p. 7 · Read the full section →
Management's definition of a now single-line business: ACA individual plans, with 93% of 2025 premium paid directly by CMS.
What Oscar sells after exiting Medicare Advantage and Small Group, and the three 2025 ICHRA acquisitions.
Oscar is a leading healthcare technology company built around a full stack technology platform and a relentless focus on member experience. We offer health plans through the ACA serving individuals, families, and employees. We have been challenging the status quo in the healthcare system since our founding in 2012 and are dedicated to making a healthier life accessible and affordable for all. Our technology drives superior experiences, deep engagement, and high-value clinical care, earning us the trust of approximately 2.0 million effectuated members, as of December 31, 2025. […] In 2025, we also acquired early-stage businesses with capabilities to help us power Individual Coverage Health Reimbursement Arrangements (“ICHRA”) and further diversify the Company. These assets include Lucie, Inc. (f/k/a INSXCloud, Inc.), a direct enrollment technology platform; IHC Specialty Benefits, Inc., an individual market brokerage; and Healthinsurance.org, LLC, a consumer education website. […] Oscar's health plans are offered in the individual market. The individual market primarily consists of policies purchased by individuals and families through health insurance marketplaces, established by the ACA and operated by the federal government, as well as other marketplaces operated by individual states (collectively, “Health Insurance Marketplaces”). Individuals and families may also purchase policies in the individual market off-exchange. Employees whose employers have chosen to offer an ICHRA are also able to purchase Oscar’s health plans.
p. 7 · Read in context →
Item 1. Business — Our Strategic Focus — p. 14 · Read the full section →
The forward bet in management's words: ICHRA displacing employer group coverage, which is what the 2025 acquisitions were bought to serve.
The stated long-term vision and the ICHRA thesis the 2025 acquisitions were made to support.
Our long-term vision is to build the consumer marketplace of the future and lead the individual market. We built our strategy around several core trends in healthcare, including rising consumer and employer healthcare costs, consumerization, digitization, and the shift towards personalization. Over time, we have been observing the overall healthcare system move towards these trends, which not only validates our strategy, but provides us with a first mover advantage. […] We continue to believe ICHRA will disrupt employer group coverage and expand individual insurance beyond the traditional ACA market. Our goal is to position Oscar as the preferred carrier for employees enrolling in health insurance through an ICHRA program. […] The businesses that we purchased in 2025, including Lucie, Inc. and IHC Specialty Benefits, Inc., provide important building blocks to support our ICHRA strategy and long-term vision to build the leading consumer health marketplace.
p. 14 · Read in context →
Item 1A. Risk Factors — Our success and ability to grow our business depend in part on retaining and expanding our member base. […] — p. 33 · Read the full section →
The largest open question for OSCR: enhanced ACA subsidies lapsed 31 Dec 2025, and both renewal and non-renewal carry costs.
eAPTC expiry, the OBBBA eligibility cuts, and why a mid-2026 renewal would itself be disruptive.
The OBBBA enacted several provisions that may impact the number of enrollees in Health Insurance Marketplaces and, by extension, the size of our member population. These include ending the APTCs for individuals who enroll in plans via the SEP with income below 150% of the FPL, prohibiting automatic re-enrollment for tax year 2028, and eliminating APTC eligibility for some formerly covered individuals (such as refugees and other immigrant populations). While we expect these provisions to result in a reduction in the number of enrolled individuals in the Health Insurance Marketplace, we cannot predict with certainty the magnitude of the impact on our membership or our business. […] Even though the eAPTCs expired at the end of 2025, it is possible that they could be renewed, but the timing of such a decision, and the manner in which the eAPTCs could be renewed, is uncertain and could occur in 2026, which could cause potential disruption and uncertainty for the 2026 OEP. […] If the eAPTCs are renewed, it is possible that a SEP would be initiated which could alter member mix and enrollment levels (including by allowing individuals who enrolled with us during open enrollment to switch to a competitor’s plan), as well as shift consumer behavior.
p. 37 · Read in context →
Item 1A. Risk Factors — Failure to accurately estimate our incurred medical expenses or overall market morbidity […] — p. 39 · Read the full section →
The mechanism behind the FY2025 loss: premiums are set a year ahead on a forecast of market morbidity, and 2025 proved it wrong.
Pricing is set in advance on projected market morbidity — the assumption the year turned on.
We set our premiums in advance of each policy year based on competitive factors in each market in which we participate as well as projections of our future expenses and of the future morbidity of the Health Insurance Marketplace. As a result, the profitability of our insurance business depends, to a significant degree, on our ability to accurately estimate and effectively manage our medical expenses and administrative costs, as well as accurately estimate the future morbidity of the Health Insurance Marketplaces and estimate our risk adjustment transfer.
p. 39 · Read in context →
From the risk adjustment risk factor: the 2025 morbidity surprise, and the statutory capital it can consume.
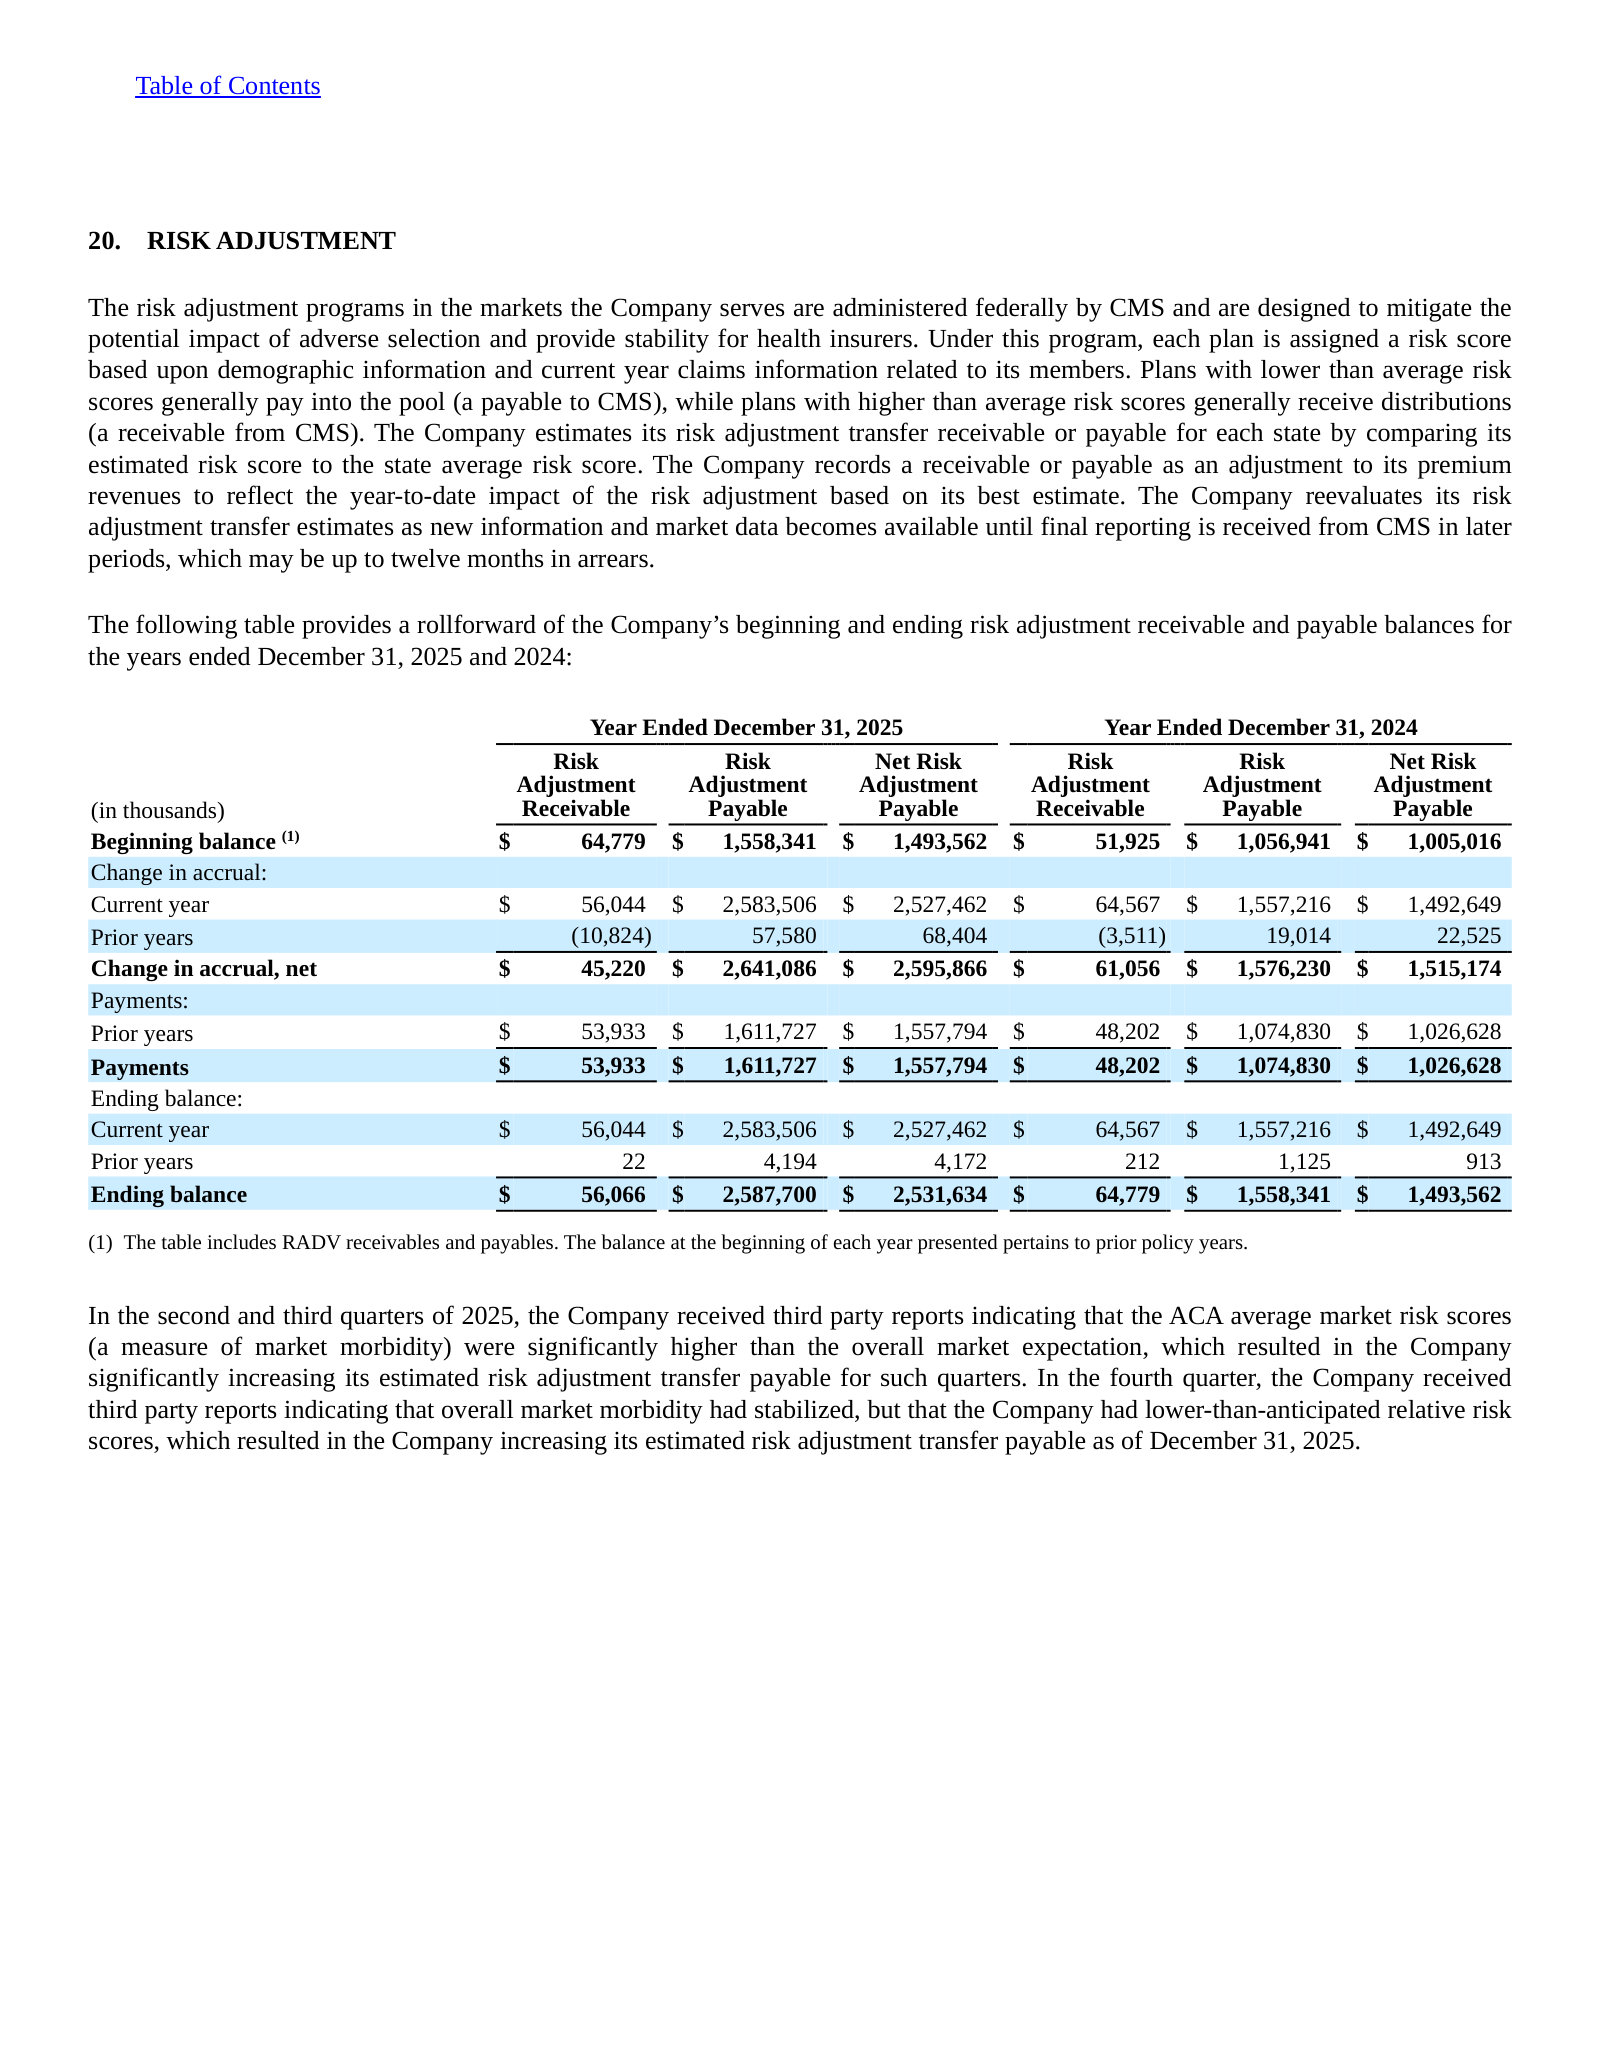
For example, in the second and third quarters of 2025, the Company received third party reports indicating that the ACA average market risk scores (a measure of market morbidity) were significantly higher than the overall market expectation, which resulted in the Company significantly increasing its estimated risk adjustment transfer payable for such quarters. In the fourth quarter, the Company received third party reports indicating that overall market morbidity had stabilized, but that the Company had lower-than-anticipated relative risk scores, which resulted in the Company increasing its estimated risk adjustment transfer payable as of December 31, 2025. […] Furthermore, a significant change in our risk adjustment transfer estimates could require us to contribute additional capital to our Health Insurance Subsidiaries to meet statutory capital requirements. We may not be able to fund the increased capital contribution requirements with our available cash resources on a timely basis, or at all and may need to incur indebtedness or issue additional capital stock.
p. 43 · Read in context →
Item 7. MD&A — Recent Developments, Trends and Other Key Factors Impacting Performance — p. 99 · Read the full section →
Management's list of what moved 2025 and what is unresolved for 2026, starting with the subsidy that built the membership base.
The eAPTCs that grew the marketplace since 2021 expired at the end of 2025.
The enhanced Advanced Premium Tax Credits (“eAPTCs”) that were previously in place since 2021 contributed to increases in the population of the health insurance marketplaces established by the ACA and operated by the federal government, as well as other marketplaces operated by individual states (collectively, “Health Insurance Marketplaces”), as well as increases in our membership. […] These eAPTCs expired at the end of 2025 and if they are not renewed in 2026, coverage could become unaffordable to some individuals and thereby reduce overall participation in the Health Insurance Marketplaces
p. 99 · Read in context →
Item 7. MD&A — Critical Accounting Policies and Estimates: Benefits Payable — p. 106 · Read the full section →
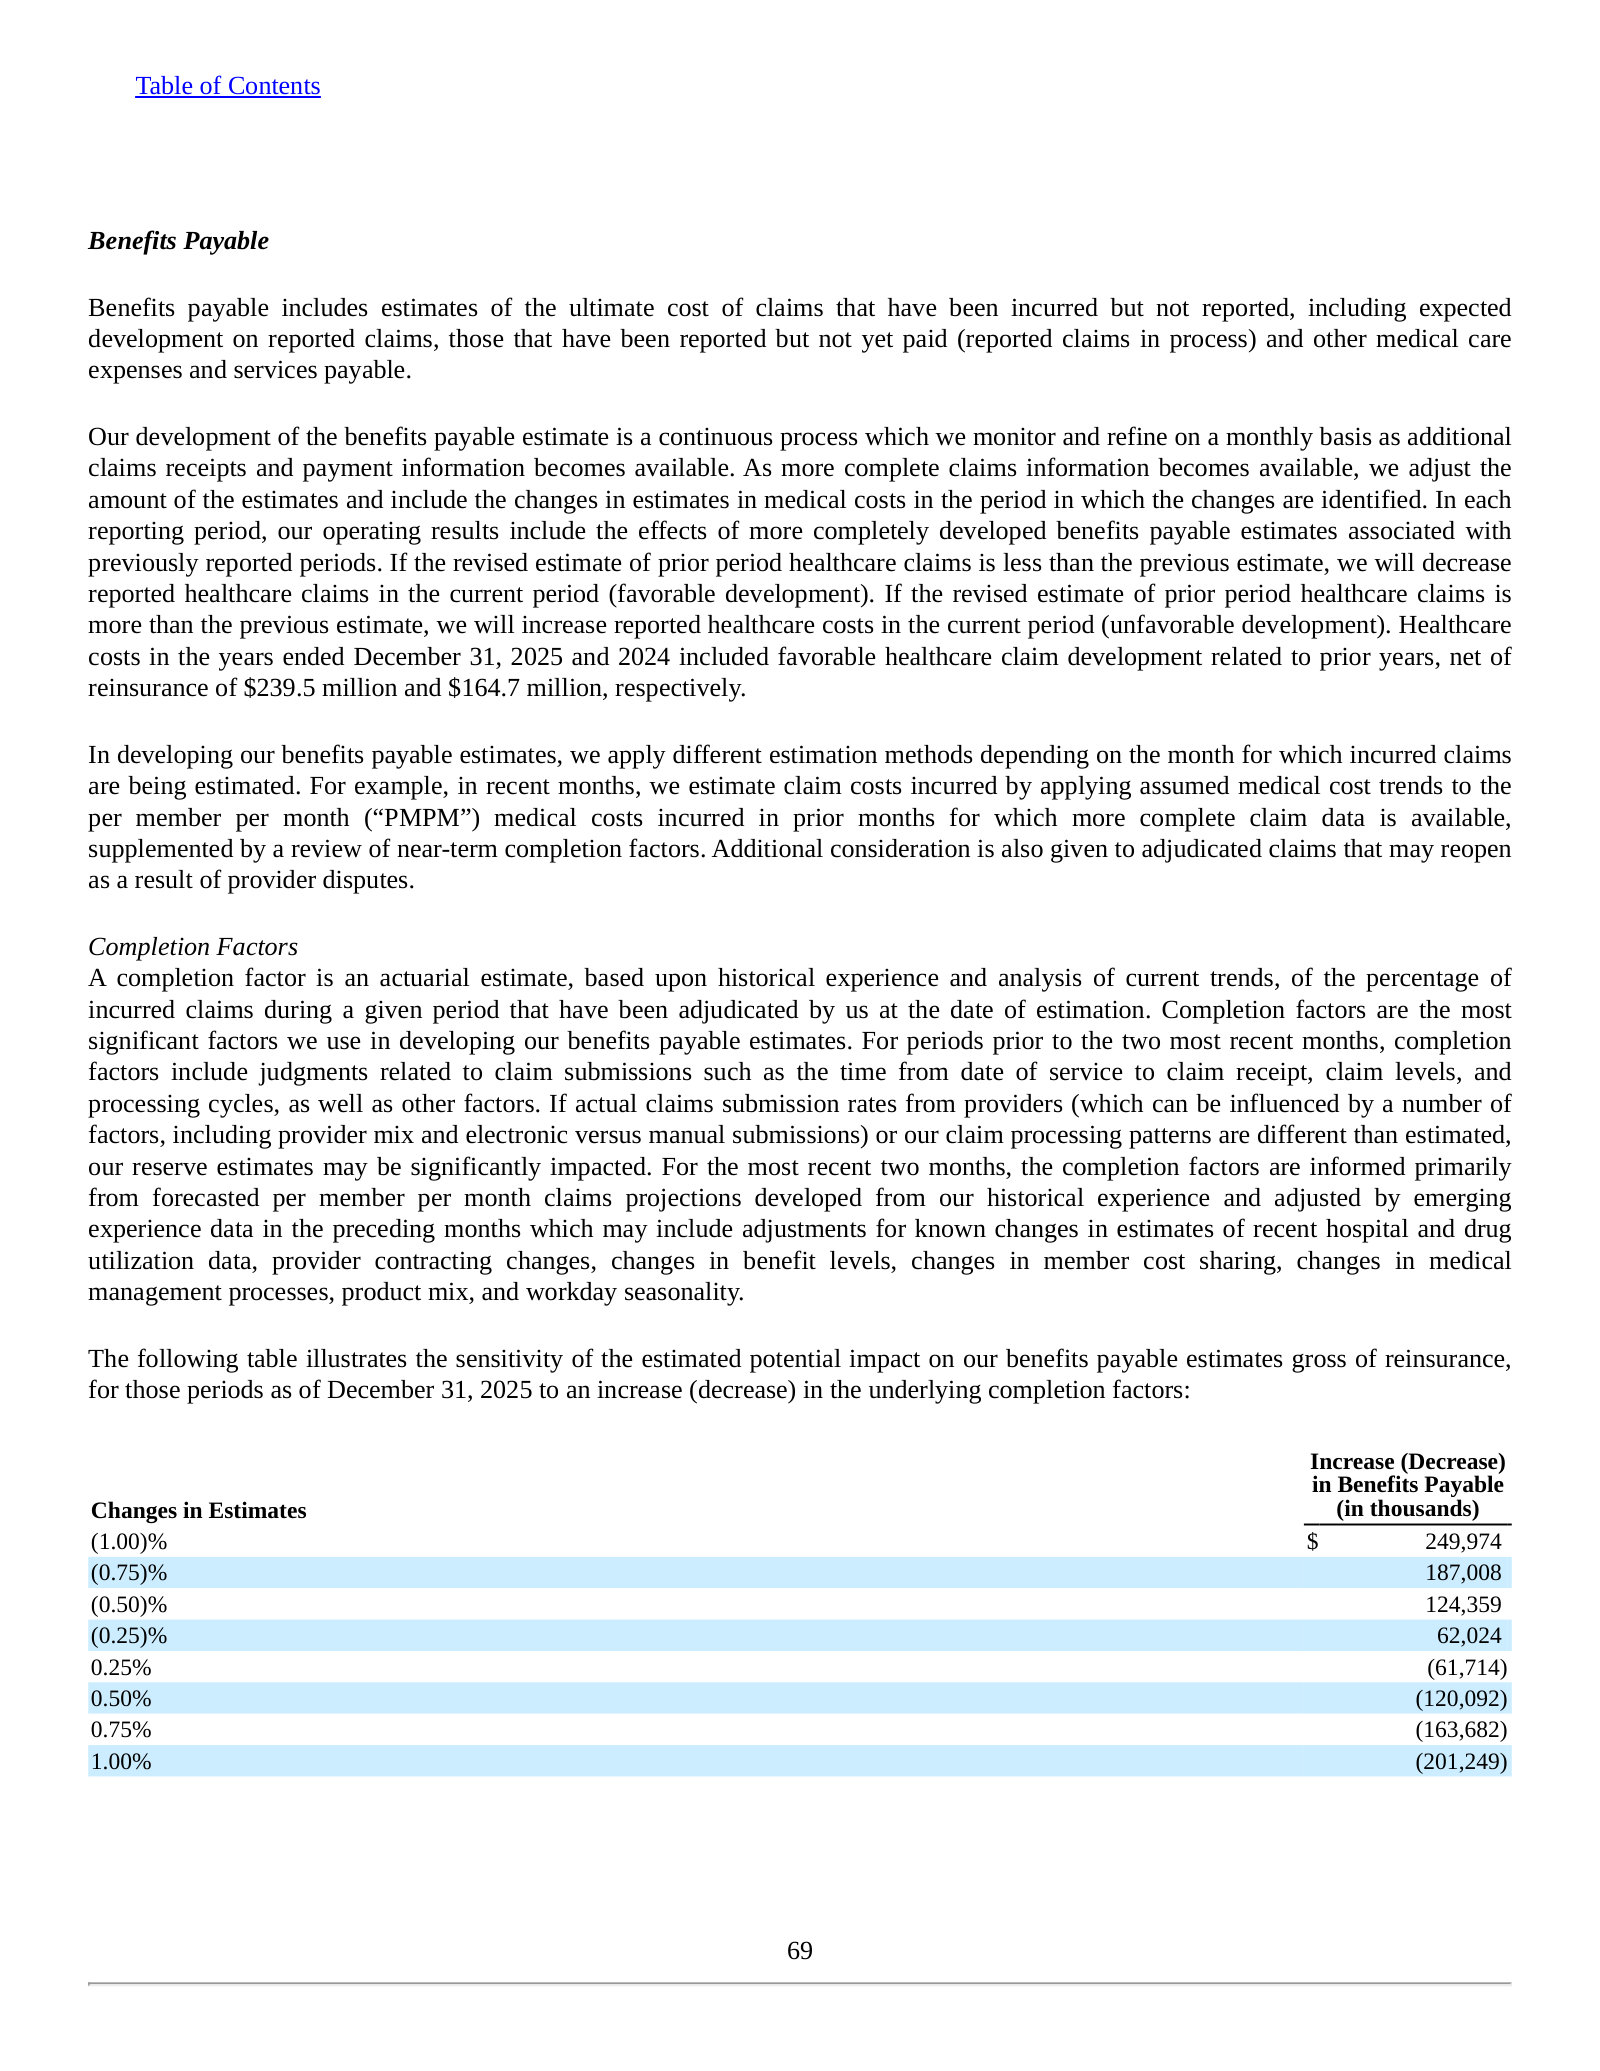
The accounting that sets reported earnings for an insurer: completion factors drive the IBNR reserve, and a 0.25% error moves it ~$62m.
How the reserve is built and why completion factors are the estimate that matters.
Our development of the benefits payable estimate is a continuous process which we monitor and refine on a monthly basis as additional claims receipts and payment information becomes available. As more complete claims information becomes available, we adjust the amount of the estimates and include the changes in estimates in medical costs in the period in which the changes are identified. […] A completion factor is an actuarial estimate, based upon historical experience and analysis of current trends, of the percentage of incurred claims during a given period that have been adjudicated by us at the date of estimation. Completion factors are the most significant factors we use in developing our benefits payable estimates. […] If actual claims submission rates from providers (which can be influenced by a number of factors, including provider mix and electronic versus manual submissions) or our claim processing patterns are different than estimated, our reserve estimates may be significantly impacted.
p. 106 · Read in context →
Item 7. MD&A — Results of Operations — p. 111 · Read the full section →
The year in one page: total revenue +27% to $11.7bn, medical expense +37%, and $57m of operating profit becoming a $396m operating loss.
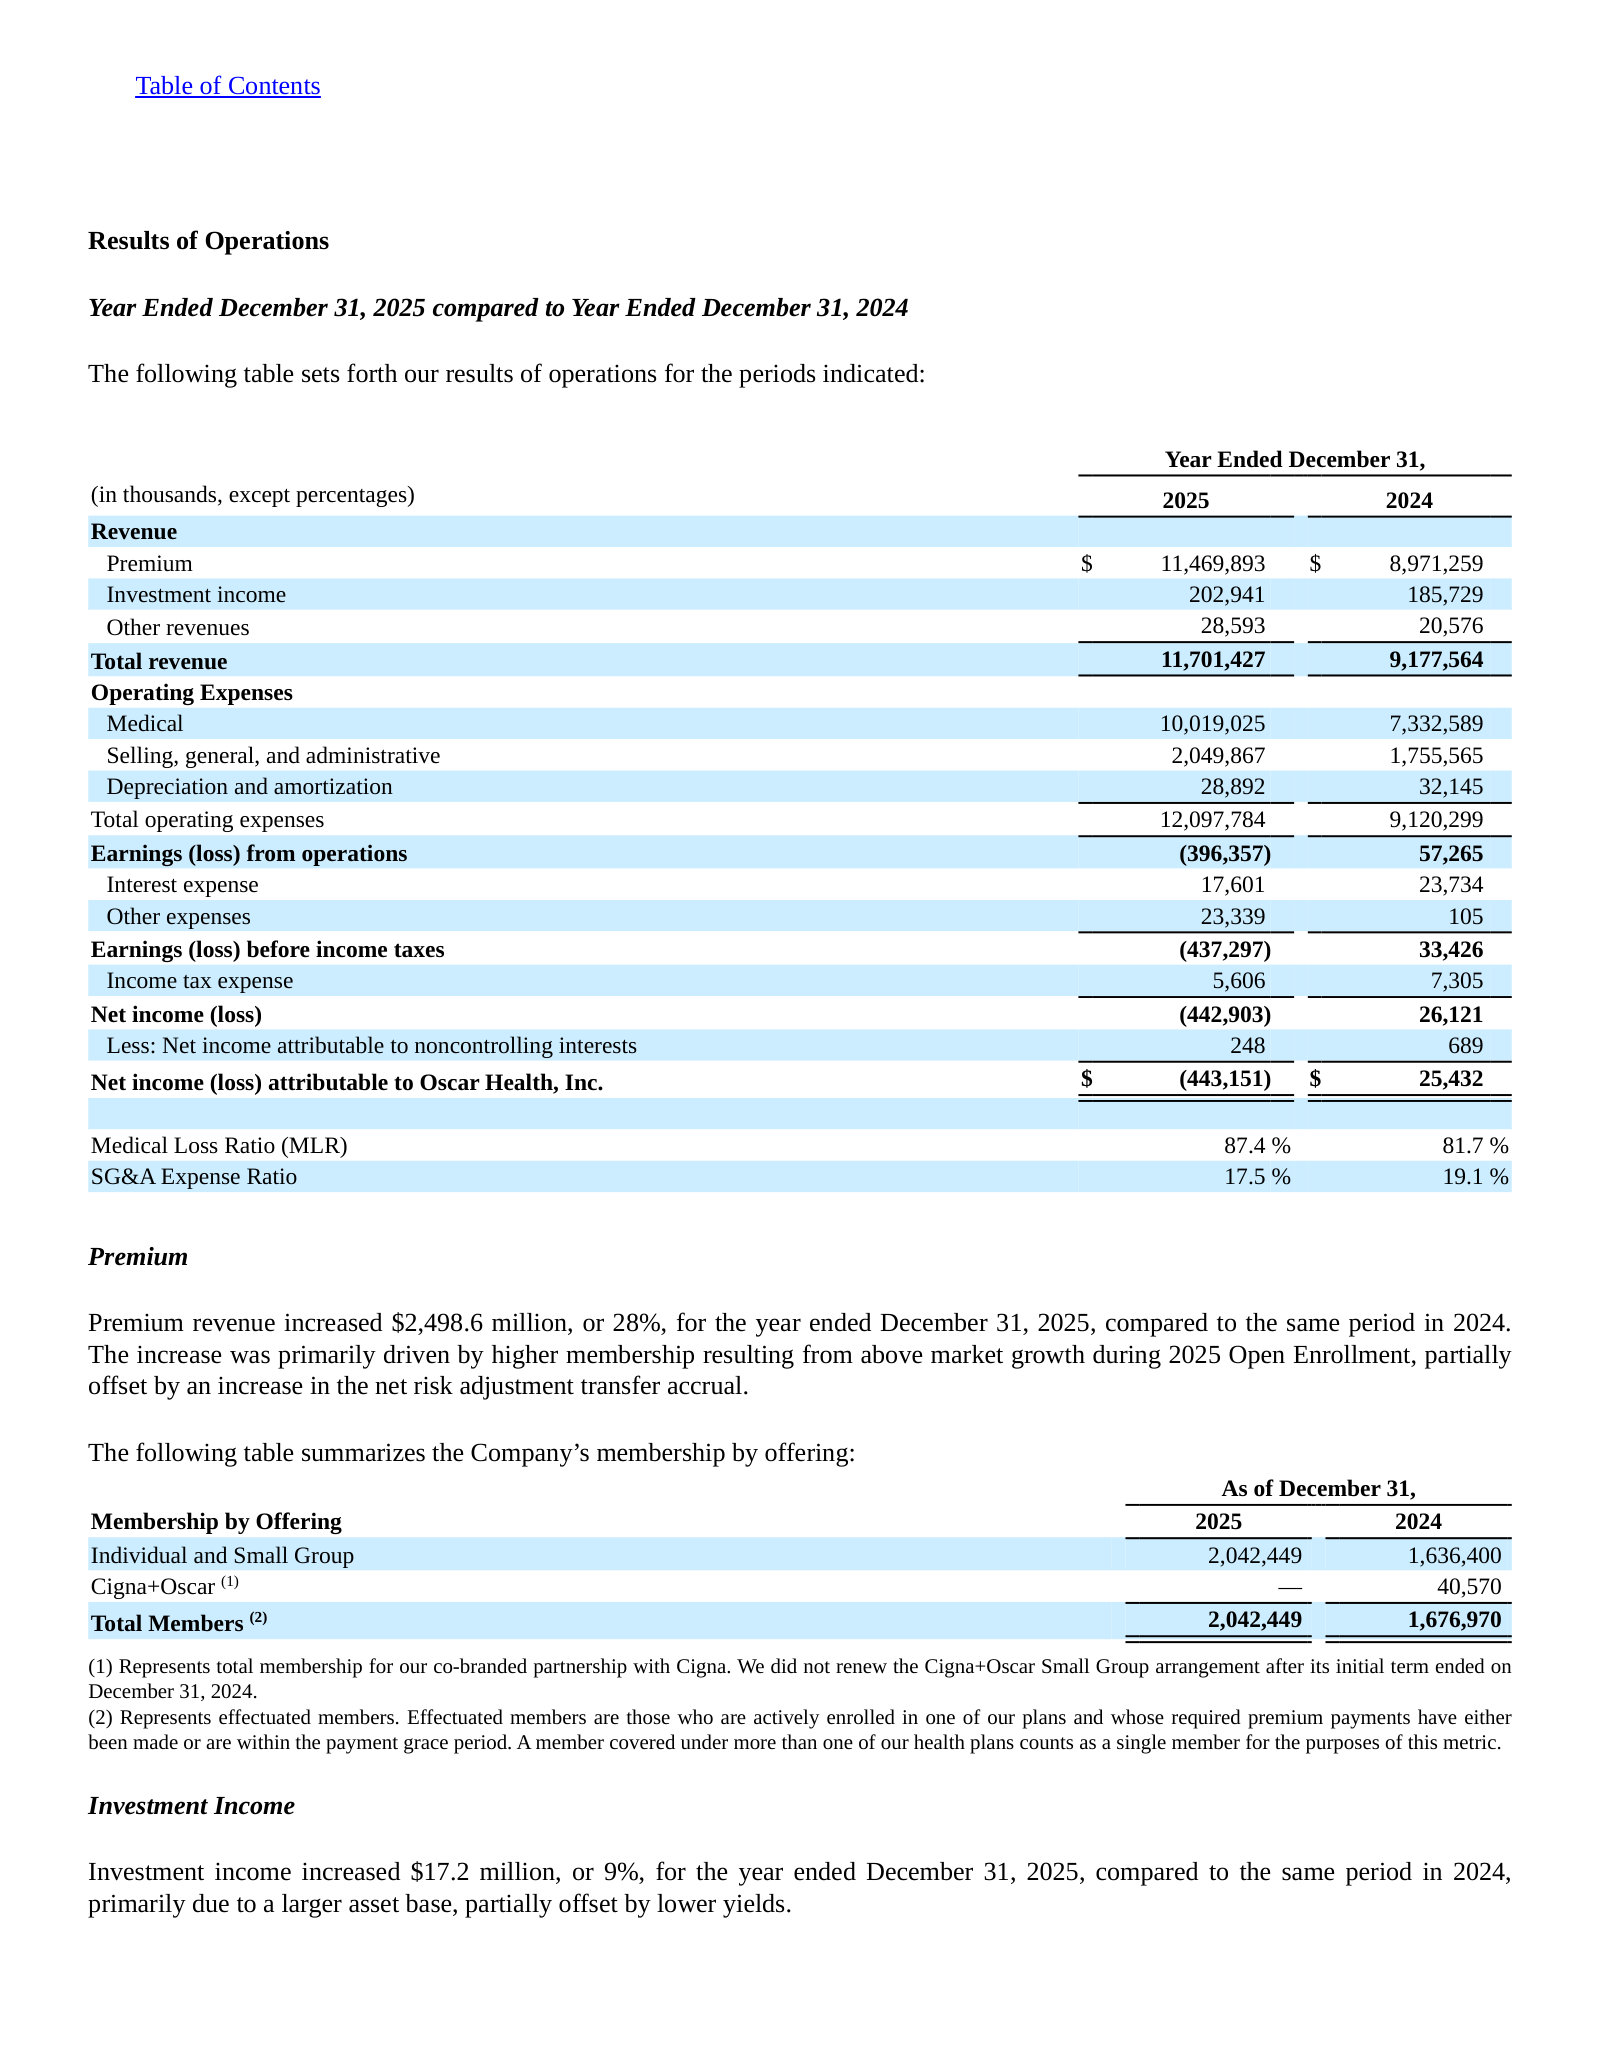
Management's attribution of the 5.7-point MLR increase and the offsetting SG&A leverage.
Medical expenses increased $2,686.4 million, or 37%, for the year ended December 31, 2025, compared to the year ended December 31, 2024, primarily due to increased membership and medical cost trend. MLR increased 5.7% year over year for the year ended December 31, 2025, primarily driven by an increase in average market morbidity that resulted in an increase in the net risk adjustment transfer accrual, as well as higher utilization that was not fully offset by risk adjustment. […] The SG&A Expense Ratio decreased 160 basis points year over year for the year ended December 31, 2025, primarily due to greater fixed cost leverage, lower exchange fee rates, and disciplined cost management, partially offset by the impact of higher risk adjustment as a percentage of premium.
p. 113 · Read in context →
Note 20. Risk Adjustment — p. 177 · Read the full section →
The rollforward that sizes the problem: the current-year risk adjustment payable rose from $1.56bn to $2.58bn in a single year.
Oscar Health, Inc. — FY2021 Annual Report (Form 10-K) — FY2021 (year ended December 31, 2021)
The first post-IPO full-year 10-K, and the clearest picture of what Oscar has since dismantled: three insurance markets and a SaaS ambition. · Open the full document →
Item 1. Business — Our Offerings — p. 7 · Read the full section →
Read against FY2025: three insurance markets and named +Oscar partners — two lines and every partner named here are now gone.
The 2021 three-market model and the +Oscar platform launch, including the Cigna and Health First arrangements.
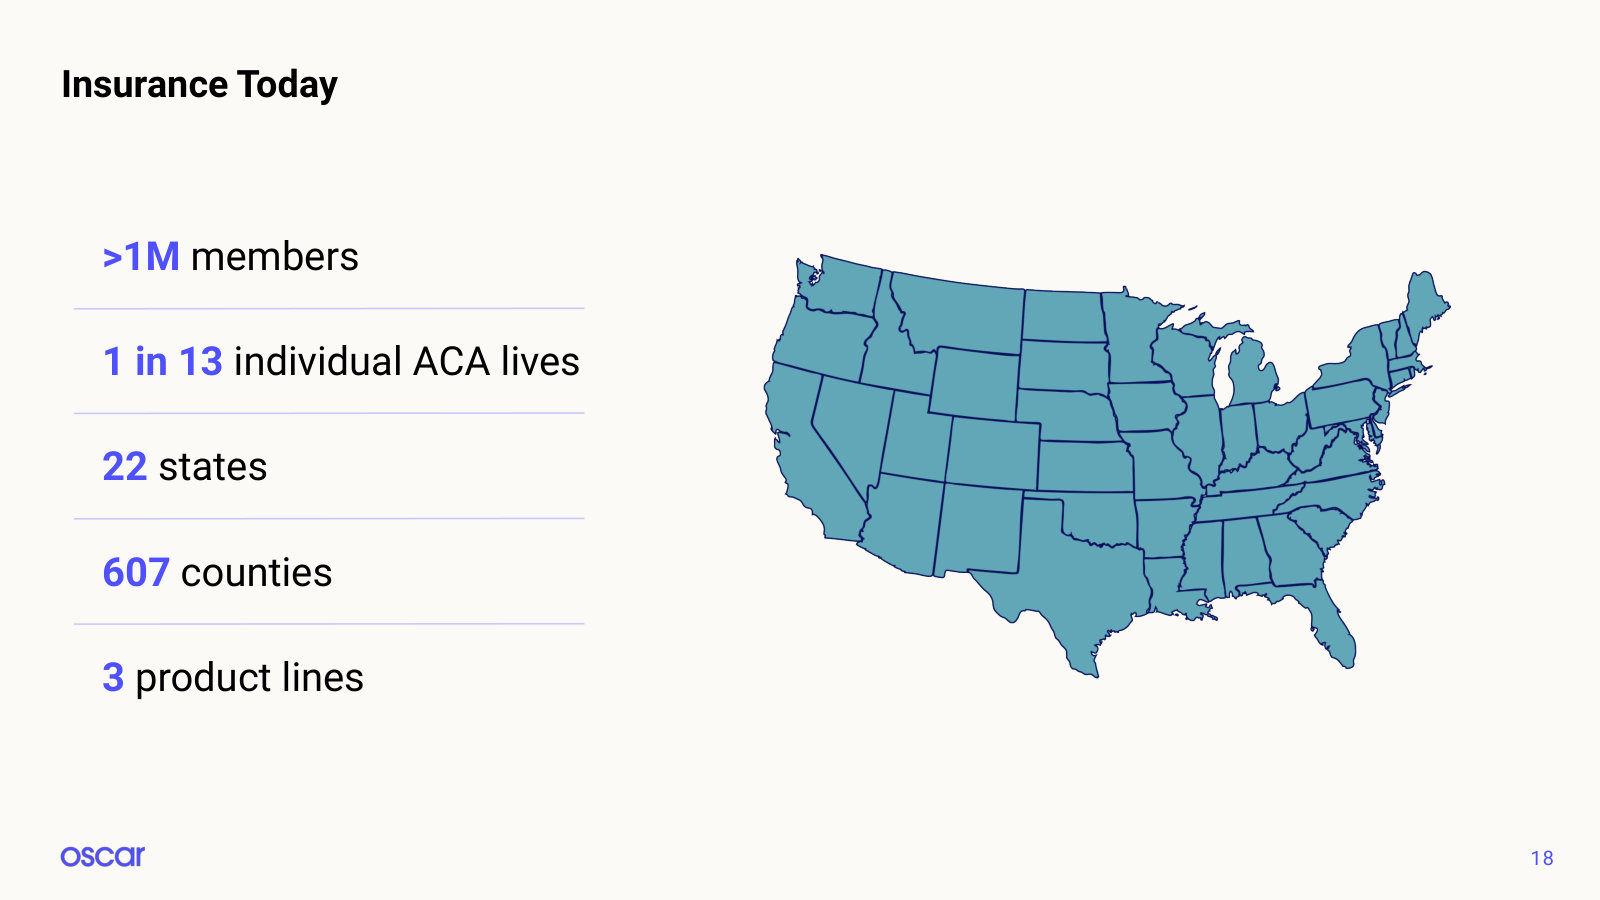
In April 2021, we launched +Oscar, our tech-driven platform designed to help provider and payor clients drive improved efficiency, growth and superior engagement with their members and patients. Through +Oscar, we are monetizing our technology platform by offering business processes as a service to our clients, including Cigna + Oscar and Health First Health Plans. Our +Oscar deals generate fee-based compensation and can include risk-sharing components. We are also pursuing opportunities to offer our +Oscar platform as a software-as-a-service (“SaaS”) to enable future growth in this business. […] Today, we offer health plans in three insurance markets: Individual, Small Group, and Medicare Advantage across 607 counties and 22 states.
p. 7 · Read in context →
Item 1. Business — Our Growth Opportunities: Monetize our platform — p. 11 · Read the full section →
The platform-monetization case as originally put — risk-sharing, fees and SaaS — which FY2025 has narrowed to one product.
The 2021 pitch for selling the technology stack into 'multi-billion dollar industries'.
We have made significant investments to build a unique full stack technology platform that enables innovation in the global health care system. As a result, we believe we are well-positioned to monetize our platform through risk-sharing arrangements (where we take risk for provider claims on behalf of our members), through fee-based service arrangements (where we charge a fee per member or other fee structure) and through the development of a SaaS offering. […] Our platform today also has the ability to deliver solutions that represent multi-billion dollar industries, such as benefits management, claims processing, virtual care, and health care data and analytics. By leveraging our technology in areas such as machine learning, predictive analytics, and multimodal communication, we have built technology that is both member-first and helps lower costs. We believe that we have the ability to power these adjacent industries with our member engagement engine and full stack technology platform.
p. 11 · Read in context →
More annual reports
Oscar Health, Inc. — FY2024 Annual Report (Form 10-K) — FY2024 (year ended December 31, 2024) · 182 pages · The one profitable year: $25.4m of net income on an 81.7% MLR, filed weeks after the Cigna+Oscar Small Group exit took effect. · Open →
Oscar Health, Inc. — FY2023 Annual Report (Form 10-K) — FY2023 (year ended December 31, 2023) · 129 pages · The reset year: the exit from Medicare Advantage for plan year 2024 is documented here, the first 10-K with Mark Bertolini as CEO. · Open →
Oscar Health, Inc. — FY2022 Annual Report (Form 10-K) — FY2022 (year ended December 31, 2022) · 124 pages · The peak-loss year — $606.3m net loss — and the last 10-K written with Medicare Advantage, Small Group and +Oscar all still in the plan. · Open →
Source: S&P Capital IQ consensus via Xpressfeed · Generated 2026-07-28.
The consensus tape has been marked up hard: FY28 normalized EPS has gone from $1.08 to $2.21 over 180 days, and FY27 revenue from $14.1bn to $19.8bn. Most of that move landed between 180 and 90 days ago; over the last 30 days revenue has sat still and only EPS is still edging higher. The prints underneath read differently, with revenue below consensus four quarters running and EPS surprises swinging violently in both directions. The street has not followed the estimates: seven holds, no buys, and targets from $13 to $35.
FY28 EPS consensus has more than doubled in six months while revenue has been flat for 30 days
The revision is lopsided: FY28 EPS is up 105% over 180 days against 48% for revenue, and in the last 30 days revenue has gone sideways while EPS still ticks up. The feed carries no analyst count for the 180-day baseline, so part of that six-month gap may be a changing estimate set rather than broker-level revisions.
Currency: USD · Scale: money in millions, absolute · Point-in-time consensus; Δ90d is Now versus 90d.
| Metric | FY | 180d | 90d | 30d | Now | Δ90d |
|---|---|---|---|---|---|---|
| EPS (normalized) | FY2027 | $1.00 | $1.45 | $1.48 | $1.51 | +4.5% |
| EPS (normalized) | FY2028 | $1.07 | $1.88 | $2.18 | $2.21 | +17.1% |
| Revenue | FY2027 | $14.05bn | $19.56bn | $19.79bn | $19.78bn | +1.1% |
| Revenue | FY2028 | $15.06bn | $21.63bn | $22.24bn | $22.23bn | +2.7% |
Four straight revenue misses, but Q1 FY26 EPS landed 88% above consensus
Revenue has come in below consensus in each of the last four quarters, the largest a 10% shortfall in Q4 FY25. Normalized EPS is the opposite: the two most recent prints missed by 35% and then beat by 88%, so the quarterly EPS line carries little predictive value.
Current sequences by metric: Revenue: 4 consecutive misses; EPS (normalized): 1 consecutive beat.
Currency: USD · Scale: money in millions, absolute · Consensus is captured before each actual first became effective.
| Quarter | Metric | Consensus | Actual | Surprise | Outcome |
|---|---|---|---|---|---|
| Q1 FY2026 | Revenue | $4.92bn | $4.65bn | -5.5% | Miss |
| Q1 FY2026 | EPS (normalized) | $1.10 | $2.07 | +88.2% | Beat |
| Q4 FY2025 | Revenue | $3.12bn | $2.81bn | -10.2% | Miss |
| Q4 FY2025 | EPS (normalized) | -$0.92 | -$1.24 | -34.6% | Miss |
| Q3 FY2025 | Revenue | $3.08bn | $2.99bn | -3.1% | Miss |
| Q3 FY2025 | EPS (normalized) | -$0.58 | -$0.53 | +8.7% | Beat |
| Q2 FY2025 | Revenue | $2.92bn | $2.86bn | -1.9% | Miss |
| Q2 FY2025 | EPS (normalized) | -$0.84 | -$0.89 | -6.5% | Miss |
| Q1 FY2025 | Revenue | $2.87bn | $3.05bn | +6.3% | Beat |
| Q1 FY2025 | EPS (normalized) | $0.81 | $0.92 | +13.9% | Beat |
| Q4 FY2024 | Revenue | $2.47bn | $2.39bn | -3.2% | Miss |
| Q4 FY2024 | EPS (normalized) | -$0.58 | -$0.62 | -6.5% | Miss |
| Q3 FY2024 | Revenue | $2.35bn | $2.42bn | +3.3% | Beat |
| Q3 FY2024 | EPS (normalized) | -$0.18 | -$0.22 | -25.0% | Miss |
| Q2 FY2024 | Revenue | $2.17bn | $2.22bn | +2.2% | Beat |
| Q2 FY2024 | EPS (normalized) | $0.15 | $0.20 | +29.0% | Beat |
Forward estimates
Currency: USD · Scale: money in millions, absolute · YoY uses the prior fiscal year from the feed; analyst count and range use the first displayed period.
| Metric | FY2025A | FY2026E | FY2027E | FY2028E | YoY | Analysts | Low / high |
|---|---|---|---|---|---|---|---|
| Revenue | $12.02bn | $18.54bn | $19.78bn | $22.23bn | — | 9 | $11.93bn / $12.10bn |
| EBITDA | -$189.83m | $525.82m | $725.93m | $1.01bn | — | 7 | -$232.62m / -$162.00m |
| Gross margin | 15.0% | 18.3% | 18.7% | 19.5% | — | — | — |
| EPS (normalized) | -$1.29 | $1.10 | $1.51 | $2.21 | — | 8 | -$1.42 / -$1.19 |
Eight analysts put FY27 EBITDA anywhere from $486m to $1,109m
FY27 EBITDA is the widest economically material line, with a spread worth 86% of the mean across eight analysts. Even FY26, with one quarter already reported, still carries a $0.63 to $1.49 normalized EPS range across ten analysts.
Currency: USD · Scale: money in millions, absolute · Spread/mean is absolute high-low divided by absolute mean.
| Metric | Period | Mean | Low–high | Spread/mean | Analysts |
|---|---|---|---|---|---|
| EBITDA | FY2027E | $725.93m | $485.75m–$1.11bn | 85.8% | 8 |
| EPS (normalized) | FY2026E | $1.10 | $0.63–$1.49 | 78.3% | 10 |
| Revenue | FY2027E | $19.78bn | $15.22bn–$21.74bn | 33.0% | 9 |
| Revenue | FY2028E | $22.23bn | $17.56bn–$23.89bn | 28.5% | 5 |
No buys against seven holds, and targets spanning $13 to $35
Eleven ratings carry no buys and no sells: seven holds, three outperform, one underperform, for a consensus score of 2.82. The ten targets run $13 to $35 against a $24.20 mean and a $21 median, so the mean sits well above the median.
Currency: USD · Scale: money in millions, absolute · Analyst counts shown explicitly.
| Street view | Reading | Analysts |
|---|---|---|
| Recommendation mix | Buy 0, Outperform 3, Hold 7, Underperform 1, Sell 0 | 11 |
| Consensus score | 2.82 | 11 |
| Target price | mean $24.20; median $21.00; high $35.00; low $13.00 | 10 |
FY29 rests on one analyst; FY28 on five
FY29 carries a single analyst on two lines only, so the $2.62 EPS and $1,189m EBITDA are one broker's model rather than a consensus. FY28 thins to five analysts on revenue and six on EPS, meaning the FY27-to-FY28 step is drawn by a smaller panel than the FY26 and FY27 columns.
Visible Alpha broker models via S&P Xpressfeed · 10 brokers · 303 line items · freshest revision 2026-07-14.
FY-2026 is the margin inflection: MLR 86.6% to 82.9%, underwriting margin 13.3% to 17.0%
Consensus keeps grinding the loss ratio and cost ratio lower through FY-2028, but at a fraction of the FY-2026 step - the re-rating in these models is a one-year repricing event, not a trend. The combined ratio row rests on three brokers; the loss ratio has ten.
| Line | FY-2025A | FY-2026E | FY-2027E | FY-2028E | YoY | Brokers |
|---|---|---|---|---|---|---|
| Loss ratio | — | — | — | — | — | — |
| Medical loss ratio(%) | 86.6% | 82.9% | 82.3% | 81.7% | -3.7pt | 10 |
| Underwriting | — | — | — | — | — | — |
| Underwriting profit | $1.57bn | $3.09bn | $3.41bn | $3.85bn | +96.4% | 7 |
| Underwriting margin(%) | 13.3% | 17.0% | 17.6% | 18.0% | +3.7pt | 7 |
| InsuranceCo combined ratio(%) | 104.6% | 99.0% | 98.1% | 97.2% | -5.7pt | 3 |
| Costs | — | — | — | — | — | — |
| SG&A / Sales(%) | 17.5% | 16.2% | 16.0% | 15.7% | -1.2pt | 8 |
| Profit | — | — | — | — | — | — |
| Adjusted EBITDA | $-182.48m | $463.07m | $660.38m | $903.43m | +353.8% | 10 |
| Income / (loss) from operations | $-304.23m | $349.76m | $530.51m | $772.69m | +215.0% | 10 |
Enrollment stops growing after FY-2026 - PMPM of $673 rising to $789 by FY-2028 carries the top line
Individual & small group is effectively the whole company here: the total and segment lines barely differ. Mean and median membership diverge from FY-2027 onward, so at least one broker models a materially smaller book after the ACA subsidy reset.
| Line | FY-2025A | FY-2026E | FY-2027E | FY-2028E | YoY | Brokers |
|---|---|---|---|---|---|---|
| Members | — | — | — | — | — | — |
| Total membership(K#) | 2.08m Number | 2.75m Number | 2.80m Number | 3.02m Number | +32.4% | 10 |
| Total membership - Individual & small group(K#) | 2.08m Number | 2.74m Number | 2.79m Number | 2.93m Number | +31.7% | 10 |
| Price | — | — | — | — | — | — |
| Per member per month (PMPM)($) | $565.9 | $673.1 | $736.6 | $789.2 | +18.9% | 9 |
| Per Member Per Month (PMPM) - Individual & small group($) | $555.1 | $597.4 | $653.0 | $682.8 | +7.6% | 7 |
| Premium | — | — | — | — | — | — |
| Direct and assumed premiums | $14.11bn | $22.70bn | $24.86bn | $27.88bn | +60.9% | 9 |
| Premiums earned | $11.79bn | $18.29bn | $19.66bn | $21.86bn | +55.1% | 10 |
Modeled profit is front-loaded: 1QFY-2027 MLR of 70.3% against 92.8% in 4QFY-2026
Membership peaks in 1QFY-2026 and attrites through the year, so the worst loss ratio lands on the smallest base. Brokers then model an even lower first-quarter loss ratio in FY-2027, which is the single largest swing factor inside the FY-2027 annual numbers.
| Line | 3QFY-2025A | 4QFY-2025A | 1QFY-2026A | 2QFY-2026A | 3QFY-2026E | 4QFY-2026E | 1QFY-2027E | 2QFY-2027E | Brokers |
|---|---|---|---|---|---|---|---|---|---|
| Medical loss ratio(%) | 89.0% | 91.8% | 76.3% | 82.1% | 86.5% | 92.8% | 70.3% | 80.4% | 10 |
| Adjusted EBITDA | $-119.49m | $-209.80m | $468.12m | $171.12m | $-49.92m | $-385.20m | $790.24m | $278.12m | 10 |
| Underwriting profit | $325.92m | $250.32m | $1.12bn | $824.18m | $605.97m | $310.24m | $1.44bn | $978.00m | 7 |
| Premiums earned | $3.03bn | $3.07bn | $4.87bn | $4.67bn | $4.58bn | $4.46bn | $4.90bn | $4.98bn | 10 |
| Total membership(K#) | 2.03m Number | 2.08m Number | 3.12m Number | 2.93m Number | 2.82m Number | 2.72m Number | 2.95m Number | 2.88m Number | 10 |
The FY-2027 dispute is the size of the book and how much margin it carries
The loss-ratio spread alone is worth more than the entire modeled EBITDA at the low end, which is why the profit range is so wide. Free cash flow disagreement is wider still and spans zero, because cash conversion depends on whether the book keeps growing.
| Line | Period | Median | Q1–Q3 | Min–max | Brokers |
|---|---|---|---|---|---|
| Adjusted EBITDA | FY-2027E | $668.66m | $619.72m–$740.72m | $151.09m–$1.11bn | 10 |
| Medical loss ratio(%) | FY-2027E | 82.5% | 81.7%–82.7% | 80.0%–84.7% | 10 |
| Total membership(K#) | FY-2027E | 2.93m Number | 2.65m Number–2.99m Number | 2.29m Number–3.09m Number | 10 |
| Per member per month (PMPM)($) | FY-2027E | $733.7 | $708.3–$742.8 | $680.8–$825.6 | 9 |
| Free cash flow (FCF) | FY-2027E | $1.07bn | $422.88m–$1.14bn | $-249.69m–$2.05bn | 9 |
Everything outside Individual & Small Group is one or two brokers, last revised in 2024
The Medicare Advantage membership and PMPM lines carry one to two brokers with revision dates in 2024, and the Cigna + Oscar lines are a single broker. Read them as one analyst's stub, not as a view of the street. Segment insight in this feed is effectively limited to the Individual & Small Group book.
Headline P&L consensus, momentum and beat/miss live in the CapIQ tab.
Source: S&P Capital IQ transcripts via Xpressfeed · latest indexed call 2026-05-06 · generated 2026-07-28.
Latest call digest
Oscar Health, Inc., Q1 2026 Earnings Call, May 06, 2026 · 2026-05-06T12:00:00
Q1 2026 — May 6, 2026. Prepared remarks were a clean beat: revenue of $4.6 billion (+53%), MLR of 70.5% (490 bps better year-over-year), an SG&A ratio of 15.2%, earnings from operations of $704 million and net income of approximately $679 million on 3.2 million members (+56%). Full-year guidance was reaffirmed in full — revenue of $18.7 billion to $19 billion, MLR of 82.4% to 83.4%, SG&A of 15.8% to 16.3% and earnings from operations of $250 million to $450 million — with management saying results are ahead of plan and that Oscar is positioned to meet or exceed the guide. Mark Bertolini used the prepared section mainly for strategy: the Lucie Health Marketplace, ICHRA X, and an Investor Day on September 16.
The Q&A went somewhere else. Roughly half the questions were about one line item: risk adjustment. Oscar accrued risk adjustment at about 24% of premium in the quarter against a full-year guide of approximately 20%, and Andrew Mok (Barclays) and Jonathan Yong (UBS) both pressed on the gap. Richard Blackley's explanation is mechanical — seasonally low first-quarter claims suppress the denominator, and a heavier bronze mix pushes deductible-driven claims later in the year — with normalization expected as members engage. Asked what could still move 2026 EBITDA, Bertolini answered with the Wakely reports and risk adjustment, noting the accrual was 11% at this point last year versus 24.5% now.
What management chose not to book is the more interesting disclosure. Prior period development was $68 million net favorable, but that nets $85 million of adverse development on a couple of 2025 states against $150 million of favorable claims run-out; other states with positive development were left unrecognized pending the final report. Reserves remain set on the pricing-era market morbidity assumptions, so the favorability visible in the new Wakely report is described as a potential tailwind rather than something already in the numbers. Utilization was characterized as unremarkable, and the paid-membership walk (3.4 million to 3.2 million to roughly 3 million on April 1) tracked plan, with most of the drop-off members who never made a payment. The one question management declined to quantify was Lucie's financial contribution.
Participant coverage from the latest call.
| Group | Participants | Count |
|---|---|---|
| Management | Operator; Chris Potochar — Vice President of Treasury & Investor Relations, Oscar Health, Inc.; Mark Bertolini — CEO & Director, Oscar Health, Inc.; Richard Blackley — Chief Financial Officer, Oscar Health, Inc. | 4 |
| Analysts | Jessica Tassan — Director & Senior Research Analyst, Piper Sandler & Co., Research Division; John Ransom — MD of Equity Research & Director of Healthcare Research, Raymond James & Associates, Inc., Research Division; Andrew Mok — Director, Barclays Bank PLC, Research Division; Samuel Becker — Research Analyst, Goldman Sachs Group, Inc., Research Division; Jonathan Yong — Analyst, UBS Investment Bank, Research Division; Olivia Miles — Research Analyst, Robert W. Baird & Co. Incorporated, Research Division; Raj Kumar — Research Analyst, Stephens Inc., Research Division; Craig Jones — Research Analyst, BofA Securities, Research Division; Dillon Nissan — Research Analyst, Wolfe Research, LLC | 9 |
Curated latest-call exchanges; one row per analyst topic.
| Analyst | Firm | Topic | What changed in Q&A |
|---|---|---|---|
| Andrew Mok | Barclays Bank PLC, Research Division | Risk adjustment accrual vs. full-year guide | Pressed on why risk adjustment transfer is tracking around 24% of premium while the full-year expectation stays at approximately 20%. Blackley attributed it to seasonally low first-quarter claims mechanically lifting the accrual and to a higher share of new members in bronze plans, with normalization expected as deductibles are met. |
| Jonathan Yong | UBS Investment Bank, Research Division | Whether the accrual included 2025 cleanup | Asked directly whether any 2025 sweep sat inside the number. The answer surfaced the quarter's most specific disclosure: about $85 million of adverse development from a couple of states on the last 2025 Wakely report was recognized, other states with positive development were not, and $150 million of favorable claims run-out produced the $68 million net favorable PPD. |
| Jessica Tassan | Piper Sandler & Co., Research Division | Churned members and market morbidity | Asked whether the roughly 200,000 members who fell off between the first quarter and April 1 pulled utilization forward, and whether Oscar agrees with Wakely's market morbidity range. Blackley said the bulk never made a payment and that claims are not paid once a member is delinquent; on Wakely he would say only in line to favorable, this early. |
| Samuel Becker | Goldman Sachs Group, Inc., Research Division | Swing factors for 2026 EBITDA | Asked what could still materially shift the 2026 view. Bertolini named the Wakely numbers and risk adjustment, and framed the year-over-year comparison as 11% risk adjustment at this point last year against 24.5% now. His answer trails off in the transcript with no follow-up. |
| Olivia Miles | Robert W. Baird & Co. Incorporated, Research Division | Lucie Health Marketplace economics | Asked whether revenue or EBIT contribution from Lucie is in the 2026 guide, and for a revenue basis or long-term target. No figures were given: Bertolini described the model and deferred detail to September, and Blackley said standing-up costs are in guidance with a modest effect this year. |
| John Ransom | Raymond James & Associates, Inc., Research Division | SG&A trajectory and April membership | Asked why the SG&A ratio would rise if revenue gets a lift from lower risk adjustment. Blackley said SG&A dollars grew 46% against 53% revenue growth, called the first quarter the likely low point for the year, and guided to sideways-to-slightly-up with a fourth-quarter uptick for open enrollment. Confirmed roughly 3 million members as of April 1. |
| Craig Jones | BofA Securities, Research Division | Bronze mix and the risk adjustment payable | Asked how a mix shift toward bronze affects risk adjustment year-over-year. Blackley argued the formula's coefficients are designed to be roughly metal-neutral, and that Oscar's transfer is driven more by overall utilization levels and market and product selection than by metal mix. |
| Raj Kumar | Stephens Inc., Research Division | Effectuation rates and competitor exits | Asked about market-level effectuation and how a competitor exit flows into 2027 pricing. Blackley said effectuation has run as expected to modestly favorable and consistent with Wakely's assumptions; Bertolini credited broker preparation and product mapping done ahead of the subsidy sunset for the share gains. |
| Dillon Nissan | Wolfe Research, LLC | Economics in newer, smaller states | Asked for early reads on Arizona, North Carolina and New Jersey. Bertolini declined on the grounds that there are not yet enough claims to differentiate; Blackley added that growth in newer markets looks strong but that it is too early to get ahead of themselves. |
Theme tracker
Themes are curator-classified across supplied calls.
| Theme | Status | Quarters mentioned | Read-through |
|---|---|---|---|
| Risk adjustment estimation and market morbidity | persisted | Q2 2023, Q3 2023, Q4 2023, Q1 2024, Q2 2024, Q3 2024, Q4 2024, Q1 2025, Q2 2025, Q3 2025, Q4 2025, Q1 2026 | Present in every call in the set, but its character changed. Through 2023 and 2024 it was a modelling topic that mostly produced small true-ups; from the fourth quarter of 2024 it became the dominant earnings variable, with successive increases to the risk adjustment payable in 2025 and, in the latest call, an accrual running above the full-year guide. Management has consistently called it the hardest estimate it makes. |
| AI and technology-driven administrative leverage | persisted | Q2 2023, Q3 2023, Q4 2023, Q1 2024, Q2 2024, Q3 2024, Q4 2024, Q1 2025, Q2 2025, Q3 2025, Q4 2025, Q1 2026 | The one line where the story has run in a straight line. The SG&A ratio is cited as improving every year across the set, and analysts have repeatedly treated it as the most credible part of the model. Notably, it is also the topic that draws the fewest sceptical follow-ups. |
| ICHRA as a growth vector beyond the ACA | persisted | Q2 2023, Q3 2023, Q1 2024, Q2 2024, Q3 2024, Q4 2024, Q1 2025, Q2 2025, Q3 2025, Q4 2025, Q1 2026 | Discussed on nearly every call for three years, and still not quantified. Management said in the fourth quarter of 2025 that it is not giving out ICHRA numbers by segment because they are not meaningful enough to move the dial. The framing has moved from a carrier product to a distribution and platform business. |
| Enhanced premium tax credit expiry and market contraction | persisted | Q4 2023, Q2 2024, Q3 2024, Q1 2025, Q2 2025, Q3 2025, Q4 2025, Q1 2026 | First raised as an analyst question, then adopted by management as the organizing assumption for pricing. The 20% to 30% market contraction estimate introduced in the third quarter of 2025 has been carried forward each quarter since; the latest call says contraction is tracking in line to favorable against it. |
| Medicaid redeterminations and special enrollment membership | dropped | Q2 2023, Q3 2023, Q4 2023, Q1 2024, Q2 2024, Q3 2024, Q4 2024, Q1 2025, Q2 2025, Q3 2025, Q4 2025 | A central topic for eleven consecutive calls — it drove both the 2024 growth story and the 2025 morbidity problem — and absent from the Q1 2026 call entirely. The continuous monthly special enrollment period ended in September 2025, and membership discussion has shifted to grace-period non-payment. The disappearance looks structural rather than evasive. |
| +Oscar and Campaign Builder as an external technology business | dropped | Q2 2023, Q3 2023, Q4 2023, Q1 2024, Q2 2024 | One of four stated strategic pillars in 2023, with named client wins and a lives-served count. It has not appeared in management's prepared remarks since the second quarter of 2024, and no call in the set explains the de-emphasis. Worth noting given the current pitch for Lucie rests on a similar platform-and-technology argument. |
| 2027 long-term targets (20% revenue CAGR, 5% operating margin) | dropped | Q2 2024, Q3 2024, Q4 2024, Q1 2025, Q2 2025, Q3 2025 | Repeated in prepared remarks or defended under questioning on six consecutive calls, including the second quarter of 2025 when Bertolini said 5% remains the target. Neither the fourth quarter 2025 nor the first quarter 2026 call restates it, and no analyst asked. Management now points to a September 16 Investor Day for the long-term plan. |
| Carrier-agnostic consumer marketplace (Lucie, ICHRA X) | emerged | Q2 2025, Q1 2026 | The building blocks were bought in the second quarter of 2025 — a brokerage, the INSXCloud direct enrollment platform and healthinsurance.org — and described then as not meaningful to near-term results. The first quarter of 2026 is the first call where they are presented as a named, launched business with an unregulated, higher-margin economic pitch. No revenue or margin figures have been attached to it yet. |
Guidance ledger
Quotes, calls, and speakers are source-verified; outcomes are curator-classified.
| Verbatim guidance | Call | Speaker | Curator outcome | Outcome note |
|---|---|---|---|---|
| “We continue to expect to achieve total company adjusted EBITDA profitability this year and are raising our estimate to a range of $160 million to $210 million.” | Oscar Health, Inc., Q2 2024 Earnings Call, Aug 07, 2024 · 2024-08-07T12:00:00 | Richard Blackley | kept | The Q4 2024 call reported full year 2024 adjusted EBITDA of $199 million, inside the range. |
| “We are raising our guidance for total revenue by another $200 million to a range of $9.2 billion to $9.3 billion, reflecting higher membership, driven by SEP member additions and more favorable lapse rates as compared to our expectations.” | Oscar Health, Inc., Q3 2024 Earnings Call, Nov 07, 2024 · 2024-11-07T13:00:00 | Richard Blackley | kept | The Q4 2024 call reported full year total revenue of $9.2 billion, at the low end of the range. |
| “We expect our medical loss ratio to be in the range of 80.7% to 81.7%, representing a 50 basis point year-over-year improvement at the midpoint.” | Oscar Health, Inc., Q4 2024 Earnings Call, Feb 04, 2025 · 2025-02-04T22:00:00 | Richard Blackley | missed | The Q4 2025 call reported a full year 2025 MLR of 87.4%, well above the range. Management attributed the gap primarily to higher market morbidity and the resulting risk adjustment payable. |
| “We expect earnings from operations to be in the range of $225 million to $275 million, representing a significant $193 million improvement year-over-year at the midpoint.” | Oscar Health, Inc., Q4 2024 Earnings Call, Feb 04, 2025 · 2025-02-04T22:00:00 | Richard Blackley | missed | The Q4 2025 call reported a full year 2025 loss from operations of approximately $396 million against guidance for a $225 million to $275 million profit. The guide was cut to a loss range in July 2025. |
| “We expect a loss from operations in the range of $200 million to $300 million and an adjusted EBITDA loss of approximately $120 million less than the loss from operations.” | Oscar Health, Inc., Q2 2025 Earnings Call, Aug 06, 2025 · 2025-08-06T12:00:00 | Richard Blackley | missed | Reaffirmed on the Q3 2025 call, then exceeded: the Q4 2025 call reported a full year loss from operations of approximately $396 million and an adjusted EBITDA loss of approximately $280 million. |
| “We expect these actions will eliminate approximately $60 million in administrative costs for 2026.” | Oscar Health, Inc., Q2 2025 Earnings Call, Aug 06, 2025 · 2025-08-06T12:00:00 | Mark Bertolini | unknown | Repeated on the Q3 2025 call. No subsequent call in the set quantifies realization against the $60 million figure, though the 2025 SG&A ratio improved 160 basis points year-over-year. |
| “We continue to expect a full year MLR in the range of 86.0% to 87.0%.” | Oscar Health, Inc., Q3 2025 Earnings Call, Nov 06, 2025 · 2025-11-06T13:00:00 | Richard Blackley | missed | Full year 2025 MLR came in at 87.4% per the Q4 2025 call, above the top of the range, driven by a $275 million fourth quarter risk adjustment true-up. |
| “For 2026, we expect risk adjustment as a percentage of direct premiums to be approximately 20% based on our updated membership mix and 2025 risk adjustment experience.” | Oscar Health, Inc., Q4 2025 Earnings Call, Feb 10, 2026 · 2026-02-10T13:00:00 | Richard Blackley | pending | The Q1 2026 accrual ran around 24% of premium, which management attributes to seasonally low claims and expects to converge on 20% over the year. This is the single most load-bearing assumption in the 2026 guide. |
| “We expect earnings from operations to be in the range of $250 million to $450 million, a significant improvement of nearly $750 million year-over-year, implying an operating margin of approximately 1.9% at the midpoint.” | Oscar Health, Inc., Q4 2025 Earnings Call, Feb 10, 2026 · 2026-02-10T13:00:00 | Richard Blackley | pending | Reaffirmed on the Q1 2026 call, which reported $704 million of earnings from operations in the first quarter alone under the company's stated MLR seasonality. |
| “Total revenues are still expected to be in the range of $18.7 billion to $19 billion in 2026.” | Oscar Health, Inc., Q1 2026 Earnings Call, May 06, 2026 · 2026-05-06T12:00:00 | Richard Blackley | pending | Unchanged from the initial 2026 guide given on the Q4 2025 call. First quarter revenue was $4.6 billion. |
| “MLR remains in the range of 82.4% to 83.4%, with MLR lowest in the first quarter and highest in the fourth quarter.” | Oscar Health, Inc., Q1 2026 Earnings Call, May 06, 2026 · 2026-05-06T12:00:00 | Richard Blackley | pending | First quarter MLR was 70.5%, consistent with the stated seasonality. The full-year range assumes claims and risk adjustment normalize over the balance of the year. |
Q&A pressure map
Question counts and firms are curator tallies; analyst coverage shown above.
| Topic | Questions | Firms | Pressure / response |
|---|---|---|---|
| Risk adjustment accrual and market morbidity | 7 | Piper Sandler & Co., Research Division, Barclays Bank PLC, Research Division, Goldman Sachs Group, Inc., Research Division, UBS Investment Bank, Research Division, Robert W. Baird & Co. Incorporated, Research Division, BofA Securities, Research Division | Counts are for the Q1 2026 call, where this topic took most of the Q&A. Six firms circled the same gap from different angles: the quarter accrued near 24% of premium against a 20% full-year guide. Management's answers were consistent and mechanical, and each disclosed something the prepared remarks did not — the bronze-mix seasonality, the $85 million of unrecognized state-level offsets, and the decision to hold reserves at pricing-era morbidity assumptions. The topic has led the Q&A on every call since Q2 2025. |
| Membership churn, effectuation and paid members | 3 | Piper Sandler & Co., Research Division, Raymond James & Associates, Inc., Research Division, Stephens Inc., Research Division | Q1 2026 counts. Analysts are testing whether the 3.4 million to 3 million walk holds and whether the members who left were costly on the way out. Answers were specific and matched what was guided on the prior call. This line of questioning has run for four consecutive quarters, since the subsidy sunset became the base case. |
| New-market and competitor-exit economics | 2 | Stephens Inc., Research Division, Wolfe Research, LLC | Q1 2026 counts. Both questions asked for early state-level or cohort-level reads on newly acquired members; both were answered with a claims-maturity argument rather than data. Reasonable this early in a policy year, but it means the quality of the 56% membership growth is still unverified externally. |
| Lucie Health Marketplace economics | 1 | Robert W. Baird & Co. Incorporated, Research Division | Q1 2026 count. The question asked for revenue or EBIT contribution in 2026, the scaling path, and any long-term revenue basis or targets. The answer covered the strategic rationale and network economics and stated that costs are inside guidance with a modest effect, but none of the three quantitative items asked for were addressed; they were deferred to the September Investor Day. Worth flagging conservatively, since Lucie was the main new item in the prepared remarks. |
| SG&A trajectory and operating leverage | 1 | Raymond James & Associates, Inc., Research Division | Q1 2026 count. A single question, answered directly with the SG&A dollar growth rate against revenue growth and a clear statement that the first quarter is likely the low point for the year. The historic pattern holds: this is the one topic where management volunteers more than it is asked for. |
| Utilization and seasonal cost drivers | 1 | UBS Investment Bank, Research Division | Q1 2026 count. Asked whether flu or weather drove the beat. Management said neither was abnormal, that experience has been better than anticipated, and — importantly — that not all of that favorability has been booked. |
Language shifts
Only language evidence verified against the referenced component is shown.
| Observation | Verbatim evidence | Call ID | Component |
|---|---|---|---|
| Conservatism is being stated explicitly in prepared remarks rather than left to the Q&A. The phrasing echoes the reserving language used in 2023, which had largely disappeared from prepared commentary across 2024 while results were running ahead. | “We took a cautious approach to risk adjustment in the first quarter.” | 1993764732 | 2 |
| Management is now describing asymmetric recognition on the record: adverse state-level development taken in the quarter, favorable development held back. That is a deliberate framing of reserve conservatism as a stored tailwind, and it is new language in this set. | “We chose not to recognize those and wait for the final report.” | 1993764732 | 28 |
| The tone on medical cost trend has moved from problem-description to non-event. A year earlier the same executive opened prepared remarks by naming a market-wide morbidity shift; here utilization is characterized as notable for being unremarkable. | “I think the most insightful thing about utilization patterns is the lack of interesting utilization patterns.” | 1993764732 | 32 |
| Confidence expressed in mid-2025 about morbidity having stabilized preceded further deterioration. The Q3 2025 call recorded a $130 million increase to the risk adjustment payable and the Q4 2025 call a further $275 million true-up. Useful calibration for how much weight to place on similar in-line-to-favorable language now. | “But we don't see anything in our statistics through the second quarter that caused us to think that there's another leg that's going to drop in terms of market morbidity.” | 1954169326 | 52 |
| Hedging vocabulary entered the Q4 2025 call around member behavior after the subsidy sunset, in place of the firmer retention language used in prior years. The Q1 2026 call retires it: payment rates are described as consistent year-over-year and modestly favorable to plan. | “So we're not – we're hedging our bets on the level of disenrollment that will occur as a result.” | 1977980145 | 31 |
| Guidance language stepped up from reaffirming to a stated bias to the upside, a formulation that does not appear in the 2025 calls in this set. It sits somewhat awkwardly beside the decision to hold reserves at pricing-era morbidity assumptions. | “Our strong results in the first quarter are ahead of plan, and we are well positioned to meet or exceed our current guidance.” | 1993764732 | 2 |
Three years of calls point the debate at one number. Operating leverage has compounded without interruption and the underwriting commentary has been broadly reliable; what has repeatedly broken the guide is the estimate of other carriers' books. The 2026 setup differs in that the conservatism now sits in disclosed, unrecognized favorability rather than in tone, which makes the June Wakely report the checkpoint that matters more than any operating metric.
Competitors describe Oscar Health, Inc.'s market in their own filings and calls. These verified passages and visual pages show where their strategies meet, using source documents preserved in Sources.
Centene Corporation (Ambetter Health) (CNC)
The largest carrier in the ACA Individual Marketplace and the peer whose book sits closest to Oscar's in both size and shape — 3.58 million members at the end of Q1 2026 against Oscar's 3.2 million, in a 29-state footprint that overlaps Oscar's almost everywhere. Only the Commercial/Marketplace discussion is used here; Centene's Medicaid and Medicare (PDP and MA) segments, which are the bulk of its revenue, are outside the comparison. Centene also built the industry data infrastructure — the interim Wakely market report — that both companies now price and reserve against, and its 10-K carries the ICHRA thesis Oscar has made central to its own strategy.
Centene's read of the first post-subsidy plan year, from the April 2026 call, and the origin of the interim Wakely report that every carrier in this tab now cites. Two claims sit inside it. The market-level one — contraction smaller than expected, healthier members staying, a silver-to-bronze migration — is corroborated by Elevance and Molina elsewhere in this tab and is the same directional read Oscar gave. The company-level one is contested by construction: Centene argues its retained silver block is more acute than the market and should therefore draw a risk-adjustment receivable. Risk adjustment is a zero-sum transfer, so a receivable claimed by the largest carrier in a state has to be funded by the other carriers in that state. Centene had not booked the full amount as of this call.
Sarah London (Chief Executive Officer): After last year's unexpected volatility, Centene committed to finding ways to create additional and earlier visibility into this market to support long-term stability. Last fall, we reached out to many of our peers, all of whom were receptive to submitting earlier data on membership demographics. Wakely, the independent actuarial firm that calculates interim risk transfer estimates for the market throughout the year, agreed to aggregate and publish that data at the end of March. As a result of that collaboration, the industry has more visibility than it has ever had at this time of the year about overall market dynamics. […] First, the overall market contracted as expected in a post-APTCs environment. That said, market-by-market membership loss was in almost every market less than we expected, which suggests that more healthy members stayed in the market in aggregate and that our pricing was appropriate relative to the overall market morbidity. Second, the Wakely data confirmed a meaningful market-wide shift from Silver members into Bronze and to a lesser degree, Gold, consistent with our expectations and with a directional shift in our own metal distribution. Finally, and perhaps most importantly, this data, when combined with our final Q1 paid membership and a full quarter's worth of claims experience, strongly supports the view that Ambetter retains Silver membership with higher acuity relative to the market and that this membership will ultimately receive a meaningful risk adjustment offset.
p. 2 · Read in context →
Elevance Health, Inc. (Anthem Blue Cross / Wellpoint) (ELV)
The scaled Blues competitor that stayed in the individual market and expanded into it. Elevance sells on-exchange in nearly all of its Anthem service areas and pushed into Florida, Maryland and Texas in 2025 under the Simply Healthcare and Wellpoint brands — three states central to Oscar's footprint. Only the Individual/ACA discussion is used here; Elevance's employer group, Medicaid, Medicare and Carelon services businesses are outside the comparison, and the company does not break out individual ACA membership or margin separately, so the exhibits are management's qualitative reads plus the sizing of quarterly outperformance.
Elevance's stated exchange footprint from its FY2025 Form 10-K. The commercially relevant sentence is the second paragraph: while Aetna was exiting and Cigna was shrinking, Elevance added Florida, Maryland and Texas service areas in 2025 under non-Blue brands. Florida and Texas are the two largest states in the federal Marketplace and core Oscar geographies. The filing gives no membership or premium figure for the Individual book, so this establishes direction and geography, not scale — Elevance's disclosed medical membership of 44.9 million is overwhelmingly employer group, Medicaid and Medicare.
In the Individual markets, we offer on-exchange products through state- or federally-facilitated marketplaces (the “Public Exchange”) in compliance with the Patient Protection and Affordable Care Act and the Health Care and Education Reconciliation Act of 2010, as amended (collectively, the “ACA”) and off-exchange products. Federal subsidies are available for certain members, subject to eligibility, who purchase Public Exchange products.
We continue to participate in the Public Exchange in nearly all of our Anthem Blue Cross and Anthem Blue Cross and Blue Shield service areas. In 2025, we expanded our operations into select service areas in Florida, Maryland, and Texas through our Simply Healthcare and Wellpoint brands. Going forward, we expect the Public Exchange to be influenced by policy and regulatory changes, particularly around federal subsidies, compliance requirements and market stability.
p. 8 · Read in context →
Answering an analyst who asked where Elevance sits versus the industry on the new Wakely data. This is a second independent carrier confirming the silver-to-bronze migration Centene described, and adding a caveat worth carrying: the March report does not capture retroactive cancellations, non-payment or cohort maturation. Those are exactly the effectuation dynamics that determine whether first-quarter membership counts hold — relevant to reading Oscar's own 3.2 million enrolled versus roughly 3.0 million paid at the start of Q2.
Mark Kaye (Chief Financial Officer): The early Wakely report has been a helpful input because it provides visibility into market size, metal mix and enrollment patterns. The report supports our view of a greater shift towards bronze and a greater share of new sales, which has implications for relative risk in the market. I would caution it's still early; the report does not fully capture retro cancellations, nonpayment behavior or maturing cohorts. […] We feel comfortable with our pricing and positioning for sustainability in the ACA market this year. We are seeing a much more balanced bronze-silver mix this year based on new sales.
p. 12 · Read in context →
UnitedHealth Group (UnitedHealthcare exchange business) (UNH)
The one large national carrier that repriced across the board and stayed in every state it served, rather than exiting. Its posture matters to Oscar twice over: as the pricing benchmark in overlapping states, and because UnitedHealthcare voluntarily pledged to rebate its 2026 ACA profits to customers — a political marker on how much margin the individual market is expected to bear while subsidies are contested. Only the UnitedHealthcare exchange discussion is used here; Medicare Advantage, Medicaid, employer group and the entire Optum business are outside the comparison.
UnitedHealthcare's stated 2026 exchange posture: reprice nearly every state, keep the full state footprint, and hand back the resulting profit. The rebate pledge is the item with implications beyond United's own P&L — the largest US health insurer publicly conceding that earning a margin on ACA plans is politically untenable in a year when subsidy policy is unresolved. That is a reference point analysts and policymakers can apply to any carrier reporting strong individual-market margins in 2026, Oscar included. It is a voluntary commitment for one year, not a regulatory constraint, and it does not change the statutory 80% minimum loss ratio that already applies to the individual market.
Timothy Noel (President, UnitedHealthcare): In the individual ACA market, we re-priced nearly all states in response to higher medical trends and the elevated needs of ACA beneficiaries in 2025. These actions were necessary to ensure a sustainable foundation in these plans and enable us to maintain our participation in all the states we served in 2025. We are working with CMS on solutions to address consumer affordability challenges given the unfolding dynamics in the ACA marketplace. As we announced last week, we have voluntarily pledged to rebate ACA market profits back to our ACA customers this year as policymakers work to determine how to improve affordability in this marketplace. We expect both fully insured group and individual enrollment to contract and be partially offset by continued momentum in our group self-funded offerings.
p. 2 · Read in context →
Answering an analyst who asked how United's 1.3–1.4 million commercial risk-life decline splits between group and exchanges. Two disclosures matter here. United expects to shed more than 500,000 exchange members in 2026 — supply that has to land somewhere, and Oscar grew members 56% year over year in the same open enrollment. And management sets its own 2026 exchange margin expectation at roughly 1%, plus or minus 1%, while describing more than a decade in the market as never a significant earnings contributor. That is United's economics on its own book, not a market-wide margin ceiling; it does establish what the largest national carrier thinks the business is worth after repricing.
Dan Schumacher (Executive): On membership pertaining to the risk-based decline, the largest share of that membership decline is connected to our exchange business for 2026, where we continue to expect meaningful decline between now and the end of the year. […] So to parse that out specifically, 500,000 plus is attributable to the exchange business, and the remainder, to those three factors. Moving to margins, and first addressing the exchange business; over the course of the decade plus in which we have operated in that market, it has never been a significant contributor of earnings for us. Our pricing posture for 2026 coming out of 2025 is going to return that market to a positive margin business for us. However, I would expect those margins in the exchange business for 2026 to be in about the 1% range, plus or minus 1% for that business.
p. 10 · Read in context →
The Cigna Group (Cigna Healthcare individual exchange) (CI)
The peer that ran the margin-over-growth strategy first and then left. Cigna cut its individual exchange book from nearly 1 million customers in 2023 to under 400,000 by mid-2025 while the market grew, and in April 2026 announced it will exit the business entirely at the end of the year. That sequence is the clearest peer articulation of the trade Oscar is on the other side of, and Cigna's own numbers are the most usable market-growth datapoint in this set. Only the Cigna Healthcare individual exchange discussion is used here; Evernorth (PBM, specialty pharmacy, care services), stop-loss and international are outside the comparison.
The most direct market-sizing statement any peer makes in this set: Cigna's management puts industry individual-exchange enrollment up nearly 50% from 2023 to mid-2025, against its own book falling from nearly 1 million to under 400,000, after two consecutive pricing cycles at roughly double the industry average increase. "Some of our competitors showed meaningful growth" is the unnamed reference — Oscar roughly tripled membership over the same window. Read level-headed, this is a competitor explaining why it declined share that Oscar took, and asserting the share was unprofitable; the 2025 industry-wide risk-adjustment shock that followed is the argument for its side of the case.
Brian C. Evanko (President and Chief Operating Officer): I think it's important to step back and rewind the clock a couple of years to 2023. At that point in time, we served nearly 1 million customers in the individual exchanges, albeit with mixed financial performance. Based upon our performance as well as our forward view of the market, we made the strategic choice to prioritize margin over growth, which included adjustments to product and network strategies, refinements to our geographic footprint, and increased prices where necessary. And this decision to prioritize margin over growth in the individual exchanges has helped us to navigate some of the industry-wide pressures that have emerged here in 2025. And we now serve fewer than 400,000 customers in this business, down materially from the nearly 1 million we served in 2023. Additionally, across both the 2024 and 2025 pricing cycles, our nationwide price increases were roughly double the industry average in each of those years. So as a result of those actions, some of our competitors showed meaningful growth in their individual exchange businesses, while we chose to reposition our portfolio, which resulted in fewer individual exchange customers for Cigna Healthcare. […] Meanwhile, across the industry, individual exchange enrollment is up nearly 50% over that same time period.
p. 8 · Read in context →
Cigna's 2026 membership plan as given in February 2026 — flat total medical customers, with individual exchange declining and employer and international growing. Two months later the company announced it would leave the exchange business altogether, so this is the last statement of the shrink-but-stay posture before it became an exit. The 18.1 million figure is total Cigna Healthcare medical customers across all lines, the large majority of it employer-sponsored; the individual exchange book was under 400,000.
Brian Evanko (President and Chief Operating Officer): So as it relates to the Cigna Healthcare membership outlook, as you saw in the press release, we expect flat year over year at about 18.1 million lives. And really, you can think of that big picture as we expect growth in our US Employer and international health businesses offset by a decline in individual exchange customers.
p. 12 · Read in context →
The exit announcement, made on Cigna's Q1 2026 call by the incoming CEO and framed as portfolio discipline rather than a judgment on the market's economics — it is presented alongside a strategic review of eviCore as part of the same tidying. For Oscar the mechanical consequence is on the 2027 open enrollment: under 400,000 Cigna members will need new carriers, in a market where Aetna has already gone and Molina is deliberately shrinking. Cigna gives no state-level breakdown, so how much of that book overlaps Oscar's footprint is not determinable from this document.
Brian Evanko (President and Chief Operating Officer, incoming Chief Executive Officer): On the other end of the spectrum are the businesses we have divested where the assets no longer support our strategic direction or have reduced management focus from our core growth platforms. […] In keeping with this portfolio shaping discipline, today, we are announcing two additional actions. First, we are planning to exit our individual exchange business at the end of this year. We did not make this decision lightly and appreciate the importance of ensuring patients have continuity through the transition. There are no changes to coverage or networks related to this announcement, and we will support members through their open enrollment transitions into 2027.
p. 3 · Read in context →
Molina Healthcare, Inc. (Marketplace segment) (MOH)
The clearest counter-case to Oscar's strategy. Molina is deliberately pricing itself out of the Marketplace — roughly 30% average rate increases for 2026, a book cut to 280,000 members, and a stated plan to shrink again in 2027 — and its management explains, in unusual mechanical detail, the adverse-selection dynamic it believes makes a shrinking individual book dangerous. Only the Marketplace segment is used here; Molina's Medicaid business (the large majority of its $42 billion premium) and its Medicare duals business are outside the comparison.
Molina's Marketplace scale as of Q1 2026, for reference against Oscar's 3.2 million: 305,000 members declining to a planned 250,000 by year end, 70% of it renewals. Molina describes the shrinkage as intended. The comparison is one of strategy rather than of like books — Molina is a Medicaid-first company for which Marketplace is a small adjacency, while it is essentially all of Oscar.
Mark Keim (Chief Financial Officer): Meanwhile, Marketplace sold moderately higher paid renewals, ending the first quarter at 305,000. With normal market attrition, we expect membership in our Marketplace segment to end the year at approximately 250,000. Renewing members now represent 70% of our book.
p. 3 · Read in context →
Molina's July 2026 guidance cut on Marketplace — a $1.50 per share swing from gain to loss, medical cost ratio taken to 90%, and an explicit commitment to shrink the footprint again for 2027. The stated cause is not weak pricing but member acuity mix, which management attributes to the shrinking itself. This is a peer treating the individual market as a business to allocate capital away from in the same quarter Oscar is guiding to $18.7–19.0 billion of revenue in it; the segment is small enough for Molina that exiting is cheap in a way it is not for a pure-play.
Joseph Zubretsky (President and Chief Executive Officer): In Marketplace, our full year MCR guidance is now 90%. We are reducing our marketplace guidance by $1.50 per share from a gain of approximately $0.75 to a loss of $0.75 due to prior year items and current year unfavorable member acuity mix. Looking forward, we plan to again reduce our footprint and volumes in 2027 to minimize our exposure to this segment. […] However, marketplace guidance decreases by $1.50 of earnings per share as our process of deemphasizing and downsizing this business in the portfolio bears the cost of higher member acuity mix.
p. 2 · Read in context →
The mechanics behind Molina's write-down, and the most transferable piece of analysis any peer offers here. Management's account: price to be uncompetitive, the healthy leave first, the chronically ill stay for network and formulary continuity even at $50–100 a month more, and their spending shows up as high-cost drug utilization without matching HCC diagnosis codes — so risk adjustment does not fund it. Note the direction of the argument runs against a carrier that is losing share, not gaining it, and Molina concedes the market-wide acuity shift was milder than it priced for. Whether the same coding-versus-cost gap appears in a growing book is the open question it raises for Oscar.
Joseph Zubretsky (President and Chief Executive Officer): But as you recall, coming into 2026, we put on average 30% rate increases into the market, ranging from around 30% up to higher levels depending on the state, all with the sole purpose of allocating less capital to the business and reducing our footprint. Recall that we positioned the product to be #1 or #2 priced in only a handful of markets. And we were successful in doing that, now at $2.5 billion of premium and 280,000 members. We did include an element in pricing to account for the potential for an acuity shift. Now the Wakely reports are showing that acuity shift is probably less in the entire market, but we're not a microcosm of the entire market. At 280,000 members, we had more adverse selection, if you will, or member acuity mix than the rest of the market. […] It's really a simple case: as the book shrinks in size consciously due to our positioning of the product and the pricing, the old adage in insurance is people that need coverage are going to seek it. So we certainly priced for an acuity shift. Many of these members are on high-cost drug therapies — HIV, oncology and the like. And even with a $50, $75 or even $100 per month price difference, they tend to stay with the health plan that they're comfortable with, that their drug therapies will be prescribed and paid for. So we're seeing a lot of that. We're seeing high-cost drug utilization without corresponding HCCs to drive risk adjustment, which is creating an imbalance.
p. 5 · Read in context →
CVS Health Corporation (Aetna individual exchange) (CVS)
The largest single block of supply removed from the 2026 risk pool. Aetna exited the individual exchange business entirely for 2026 after a $448 million premium deficiency reserve on the 2025 coverage year, and CVS quantifies the resulting membership loss in its own results. That exit is part of the market structure behind Oscar's 56% membership growth in the same open enrollment. Only the Aetna/Health Care Benefits individual exchange discussion is used here; Caremark, retail pharmacy, Oak Street and Signify are outside the comparison.
CVS's CEO characterising the Aetna exchange exit, on the Q3 2025 call. The framing is worth noting for what it is: the exit is listed as a portfolio decision alongside an acquisition, with no market-level judgment attached. Elsewhere on the same call the CFO attributes part of the quarter's 92.8% medical benefit ratio to higher acuity in the individual exchange product line and to worsening exchange risk-adjustment expectations based on the Wakely data — the underlying reason, stated separately from the decision.
David Joyner (President and Chief Executive Officer): In my first year as CEO, I have pushed our team to act with urgency and focus as we execute on opportunities to improve our business. This means making thoughtful and difficult decisions, such as exiting our individual exchange business or taking advantage of market opportunities like our acquisition of the Rite Aid assets.
p. 1 · Read in context →
The exit quantified in CVS's own Q1 2026 results: roughly 600,000 medical members lost sequentially, attributed primarily to leaving the exchange business. Combined with UnitedHealthcare's expected 500,000-plus exchange decline and Centene's move from about 5.0 million to 3.5 million, this is the supply side of the 2026 individual market — members displaced by exits and repricing at the same time the subsidy expiration was shrinking the pool. Oscar added members through that open enrollment; how much of the gain is displaced Aetna membership is not determinable from these documents, since neither company publishes state-level or carrier-to-carrier switching data.
Brian Newman (Chief Financial Officer): In Health Care Benefits, we generated nearly $36 billion of revenue in the quarter, an increase of over 3% from the prior year. This increase was primarily driven by our government business, partially offset by our exit from the Individual Exchange business in 2026. We ended the quarter with approximately 26 million medical members, which declined sequentially by approximately 600,000 members. This decrease was primarily driven by our exit from the Individual Exchange business in 2026, partially offset by growth in our commercial fee-based membership.
p. 3 · Read in context →
More peer documents
Centene — Q2 FY2025 earnings call — Q2 FY2025 · 14 pages · Page 1 is the anatomy of the July 2025 risk-adjustment shock that hit the whole market — a $2.4bn full-year pretax hit, the three causes management assigns (healthy members exiting on program-integrity rules, higher-morbidity new sign-ups, more aggressive provider coding) and the claim that market morbidity moved 16–17% year over year in some states. · Open →
Centene — Q3 FY2025 earnings call — Q3 FY2025 · 13 pages · Page 11 is the CEO answering directly on long-term commitment to the exchange business and on ICHRA — the closest a peer comes to arguing Oscar's own thesis, including the view that growth can come from the uninsured even without enhanced subsidies. · Open →
Centene — FY2025 Form 10-K — FY2025 · 130 pages · Page 28's risk factor is the filed-document version of the competitive threat: competitors introducing pricing or broker incentives Centene cannot match, competitors exiting and stranding risk-adjustment receivables, and the admission that 2026 refiled rates may not restore profitability. · Open →
Molina Healthcare — FY2025 Form 10-K — FY2025 · 102 pages · Page 15 lays out the Marketplace Program Integrity and Affordability Rule mechanics that reshape the risk pool — shortened open enrollment from 2027, the repealed 150%-FPL special enrollment period, tightened verification — plus which provisions sunset at end-2026 and which are stayed in litigation. · Open →
UnitedHealth Group — Q2 FY2026 earnings call — Q2 FY2026 · 16 pages · Page 7 has UnitedHealthcare stating its exchange business is running better than planning expectations but contributing nothing to results because of the profit-rebate pledge — the mid-year update on how that commitment is being applied. · Open →
CVS Health — FY2025 Form 10-K — FY2025 · 185 pages · Page 111 has the accounting behind the Aetna exit: a $448m premium deficiency reserve taken in Q1 2025 on the individual exchange product line for the remainder of the coverage year, following a $270m reserve on the same line in Q3 2024. · Open →
Elevance Health — Q2 FY2026 earnings call — Q2 FY2026 · 13 pages · Pages 7–8 continue into the bidding-posture question for ACA and Medicare Advantage, and give Elevance's framing of Medicaid acuity normalisation — useful for separating individual-market dynamics from the Medicaid trend story that dominates most peer calls. · Open →
Fit
Outside the framework's universe (U2 not met); contested: P4a
Market capitalisation is $8.48 billion on the filed share count, $7.44 billion on the deterministic feature basis, against a universe line of $10 billion. Confidence: high — two model families agreed, the trial was order-stable, and load-bearing spreads were at most 0.15. No exclusion hit, no China sensitivity flag, no name-mask divergence. One criterion is contested: P4a.
The framework's own order of operations is what produced that answer: U2 not_met -> out_of_universe. Analysis continues below on every other pillar, because the miss leads the report rather than ending it.
Universe and exclusions
Here is the decisive point. The universe screen is not a valuation judgment and not a quality judgment; it is a size line, and Oscar is 15% to 25% underneath it depending on which share count is used.
Oscar's Class A common stock is registered under Section 12(b) and trades on the New York Stock Exchange as OSCR; the issuer is incorporated in Delaware, commission file 001-40154 [1]. U1 (listing) is met, four votes to nil. Nothing in the record touches the Chinese-ADR exclusion.
U2 (scale) is not met, four votes to nil, and the miss survives every share convention available in the filings.
Sources: derived — 262,388 thousand weighted-average basic shares from the deterministic feature file; 263,552 thousand Class A plus 35,591 thousand Class B outstanding at 31 March 2026 [2]; 265,530,268 Class A plus 35,591,356 Class B at 10 April 2026 [3]; all at the 27 July 2026 close of $28.34.
The arithmetic: 262.388 million weighted-average basic shares at $28.34 gives $7,436.1 million, 25.6% short of the line. The 299.143 million shares actually outstanding at 31 March 2026 give $8,477.7 million, 15.2% short [2]. The most generous count in the record — 329.751 million Q1 2026 weighted-average diluted shares — still reaches only $9,345.2 million, $654.8 million short. Reaching $10 billion on the filed count requires $33.43 a share, 18.0% above the 27 July 2026 close.
The strongest counter-fact sits inside the same treatment: the feature file's own basis understates the company by roughly $1.0 billion, because it uses the FY2025 weighted-average basic count rather than shares outstanding. Correcting it narrows the gap from 25.6% to 15.2% — and independent market-cap trackers reported $8.25 billion to $8.76 billion across June and mid-July 2026, consistent with the corrected middle case. The line is still not cleared on any basis, which is why all four jurors recorded the same verdict.
Exclusions: a clean screen. All four disqualifying checks and the sensitivity check were run against primary evidence and none hit.
- X1, auto OEM — not hit. Health insurance premium is 98.02% of FY2025 revenue ($11,469.9 million of $11,701.4 million), investment income 1.73%, other revenues 0.24% [4]. No automotive line item exists anywhere in the filing.
- X2, promotional CEO — not hit, on one prong only. The exclusion requires a repeated promise-versus-delivery gap and weak insider economic ownership. Prong one is evidenced and stated plainly: February 2025 guidance of $225–275 million of earnings from operations became a $396.4 million operating loss [5], and the 2027 target of a 5% operating margin, carried in prepared remarks on six consecutive calls and defended under questioning on 6 August 2025 [6], was absent from both subsequent calls without restatement or withdrawal. Prong two fails outright: the chief executive beneficially owned 11,925,092 Class A shares at 10 April 2026 against FY2025 total compensation of $1,149,308 with nil stock awards and nil option awards [3]. Without both prongs, the framework records no hit.
- X3, structural decline — not hit. Total revenue rose in every year from FY2021 to FY2025, reaching $11,701.4 million [4], and FY2026 is guided to $18.7–19.0 billion, up 61% at the midpoint [7]. Consecutive years of decline: zero, against a three-year disqualifier. The trial's temporary probability of 0.71 is far above the 0.35 strongly-permanent trigger.
- X4, consensus-saturated story — not hit. Oscar trades at 0.64x FY2025 revenue on the feature basis and 0.39x guided FY2026 revenue; the sell side carries no buy rating in eleven recommendations (3 outperform, 7 hold, 1 underperform) and a mean target of $24.20 against the $28.34 close. The counter-fact in the same breath: the chart shape does carry the darling signal — up 161.2% from the 30 March 2026 trough in 119 days — and Oscar is the second most expensive of seven managed-care names on price-to-sales.
- S1, China dependence — not flagged. China revenue $0 of $11,701.4 million; China assets $0 of $9,289.6 million; all 2,042,449 members at 31 December 2025 sit in 18 US states; zero occurrences of "China" or "Chinese" in the FY2025 Form 10-K.
Pattern match
This is the framework's third pattern — healthcare and insurance forecasting errors — and it fits the pattern's specific checks closely enough to name it. That is framing, not a verdict; the pillar results below are unchanged by it.
The pattern's first check is a one-year cost-trend or risk-adjustment misforecast rather than a franchise problem. Oscar's FY2025 swing was $646.4 million against its own February 2025 midpoint, and 85.5% of it is one line: risk-adjustment transfers stepped from 14.52% of direct and assumed premiums in 2024 to 18.45% in 2025, which cost $552.5 million on the 2025 premium base [8]. The volume line never broke: revenue guidance was raised at the same moment earnings were cut, from $11.2–11.3 billion to $12.0–12.2 billion [9].
The second check is the market taking the stock down roughly one-for-one with the guidance cut as if it were permanent. Here it went further than one-for-one: over the thirteen sessions from 30 June to 18 July 2025 the shares fell 37.4%, removing about $2.10 billion of market value against a $500 million midpoint guidance swing — 4.2 times the guided number and 3.3 times the realised full-year shortfall.
The third check is the repricing mechanism and its regulatory friction. Participation in each individual market is an annual election and premiums require state and federal approval [10]; Oscar refiled 2026 rates in states covering close to 99% of membership at an approximately 28% weighted average increase [11]. The ACA's minimum-MLR provision requires rebates when medical costs fall below the specified threshold, which caps underwriting margin by statute in both directions [12].
Where the pattern breaks is the entry moment. The precedent the pattern is built on involved buying the anchored price; at $28.34 the shares sit 21.8% above the $23.27 close the drawdown started from, and the first post-repricing quarter has already printed — a 70.5% medical loss ratio and $704 million of earnings from operations [13]. The full anatomy is in Dislocation and Clock.
The pillar ledger
Source: the run's deterministic fit tally; per-criterion verdicts, vote splits, trimmed-mean probabilities and spreads as recorded. Reference lines, not scores.
Year-10 gate (P1) — not met
Not met, four votes to nil, trimmed-mean probability 0.385 with a spread of 0.11. This is the framework's one binary criterion, and genuine doubt resolves downward by its own construction.
None of the five conviction sources applies in a form that would underwrite higher revenue and higher adjusted free cash flow in 2036. Approximately 98% of revenue comes from ACA-regulated plans and 93% of FY2025 premiums were earned directly from CMS, with 7% from members [10]; approximately 97% of FY2025 direct policy premiums were subsidised by advance premium tax credits, and the enhanced credits expired at the end of 2025 [14]. Market structure is not a monopoly, duopoly or stable oligopoly: the 10-K names four categories of competitor, including local Blue Cross plans [15], and every carrier re-elects its footprint annually [10]. Capital intensity is 1.01% of assets (property, equipment and capitalised software of $94.2 million against $9,289.6 million) [2], so there is no replacement-cost moat; statutory capital and surplus is a reserve, and it fell to approximately $1.0 billion at 31 December 2025 from $1.2 billion a year earlier while revenue grew 27.5% [16]. Operating history runs 14 years against the framework's 30-to-50-year anchor, with one profitable year in it and an accumulated deficit of $3,294.4 million [17].
The deciding arithmetic is a reversion sensitivity. Management-reported footprint share moved from approximately 10% in plan year 2020 [18] to 17% in 2025 and 30% in 2026 [19]. Scaling the FY2026 revenue guidance midpoint of $18.85 billion back to the 2025 share level (17/30 = 0.5667) gives $10.68 billion — below FY2025 actual revenue of $11.70 billion, and 43.3% below the guided level, with no operating failure at Oscar required. A 13-point single-year share move is not the signature of a protected position.
The strongest surviving counter-fact belongs in the same treatment: Oscar grew straight through the shock the doubt is built on. Membership reached 3.2 million at 31 March 2026, up 56% year on year [20], and the addressable market contracted only about 5% at open enrollment — 23 million lives against a record 24 million [21] — against management's own planning assumption of a 20% to 30% contraction [7]. Essentiality of the product is evidenced rather than asserted. What the resilience does not establish is durability of the subsidy that sizes the market. Full treatment in Durability and Business.
Consistency (P2) — not met
Not met, four votes to nil, no probability recorded. The deterministic test could not be run: fit_features.fcf_stability and fit_features.adjusted_fcf are both not_computable, so the series below was rebuilt from the filed cash-flow statements using the framework's definition unchanged.
Source: derived — adjusted FCF = operating cash flow less capital expenditure less stock-based compensation, with no acquisitions line disclosed; from the FY2025 Consolidated Statements of Cash Flows [22] and the FY2022 statements for the earlier years [23].
The deciding arithmetic: the two available rolling five-year averages are $100.2 million (FY2020–FY2024) and $259.8 million (FY2021–FY2025), a move of 159% between adjacent windows. Adjusted FCF changed sign in four of the seven years on file. The framework tolerates a negative episode every five to eight years as part of an insurer's cycle; Oscar has had one every other year. Only two windows exist at all, which is too few to characterise stability with confidence in either direction — that limitation cuts both ways and is recorded as a data gap.
The counter-fact, and it is a real one: the risk-adjustment payable build is partly genuine insurance float rather than a timing trick. Oscar paid $1,611.7 million of prior-year transfers during 2025 and still closed the year with a $2,587.7 million gross payable, and reported operating cash flow was positive and rising — $978.2 million in FY2024, $1,094.9 million in FY2025 [22]. The independent check applied to this claim revised one figure: stripping only the risk-adjustment payable build leaves four of six years negative, not five, with a cumulative -$817.3 million. The no-stable-base conclusion held. Full treatment in Yield and Durability.
Dislocation and yield (P3a, P3b, P3c, P3d)
P3a, identifiable event — met, four votes to nil. The trigger is dated twice. On 1 July 2025 Centene disclosed that first-look Wakely Marketplace data implied market morbidity far above its risk-adjustment assumptions and withdrew 2025 guidance; the ACA-exposed group repriced the next day, and Oscar closed down 18.7% on 78.0 million shares, 29.1 times its pre-peak median daily volume. Three weeks later, on 22 July 2025, Oscar filed an 8-K revising its own full-year outlook [24], to revenue of $12.0–12.2 billion and a loss from operations of $200–300 million against original guidance of $225–275 million of earnings [9]. The counter-fact: the fall is not one event's work. The first 21.2% leg, from 19 September to 5 November 2024 over 33 sessions at 1.2x normal volume, came with no company disclosure attached — precisely the drift the framework excludes as an entry moment.
P3b, capitulation — met, four votes to nil. The measured 20-session volume spike is 15.47x the trailing median (41.5 million shares against 2.68 million), against a reference line of 2x, with single sessions at 30.8x, 29.1x and 24.4x. The counter-fact sits in the same entry: the spike window ended 29 July 2025 at $13.84, already 40.5% below the peak, and the price fell a further 21.6% over the following eight months to the $10.85 low of 30 March 2026. Peak emotional selling did not mark the price low.
P3c, yield versus bar — not met, four votes to nil. Oscar classifies fortress on the framework's own rule (net debt of -$2,344.1 million: $430.1 million of long-term debt against $2,774.2 million of cash) [25], which selects the 8.5% reference line rather than the 10% default.
Source: derived — adjusted FCF from the filed cash-flow statements [22] over the $7,436.1 million market capitalisation of record; fit_features.adjusted_fcf_yield and fit_features.yield_baseline are both not_computable for this run.
The FY2025 reading of 13.06% clears the line by 456 basis points, and it is the number that does not survive inspection. In plain terms it is not earnings; it is working-capital float. The CMS risk-adjustment payable rose $1,029.4 million in the same year — 106% of the $970.8 million numerator — while the company lost $443.2 million; strip working capital entirely and adjusted FCF is -$488.2 million [22]. The three-year average is 6.07%, 243 basis points short of the fortress line and 393 short of the default; the five-year average is 3.49%. Normalised for the underwriting cycle at a 3.5% mid-cycle operating margin on the guided FY2026 revenue base, adjusted FCF is $586.3 million and the yield 7.88% — 62 basis points short, with a 4.27% to 11.50% band across a 2% to 5% margin. The jurors recorded the position two ways, at -243 basis points on the three-year average and -62 on the mid-cycle base case; both sit below the line. There is also no stable historical baseline to have jumped from: annual readings run -20.9%, +45.7%, -22.6%, +23.5% and +25.8% across FY2021–FY2025.
The counter-fact, which the independent check confirmed and which narrows the finding: the window is decisive. The adjacent FY2024–FY2025 average is $905.7 million, or 12.18%, above the line; the FY2021–FY2025 average is 3.49%, well below it. The three-year window is dominated by FY2023, when adjusted FCF was -$457.4 million at roughly half the current revenue scale.
P3d, forward path — met, four votes to nil, probability 0.565 with a spread of 0.02. The vendor consensus free-cash-flow line is not usable as an anchor: it reports no contributor count, does not reconcile to its own cash-from-operations less capex in any year, and missed the now-actual FY2025 by 43.7% ($596.3 million against $1,058.5 million reported). The reconciled net-income proxy gives 5.35% for 2026, 7.38% for 2027 and 9.94% for 2028 — clearing the 8.5% line in 2028 by 144 basis points on the market capitalisation of record, and by 22 basis points on the filed share count. The counter-fact: the repricing that would carry that path is already in force rather than forecast, with Q1 2026 delivering a 70.5% medical loss ratio and the lowest administrative expense ratio in company history at 15.2% [13]. Full treatment in Yield; the drawdown anatomy is in Dislocation.
Balance sheet and self-help (P4a, P4b, P4c)
P4a, outlast and allocation headroom — contested, two votes to two, split by model family. Both readings are set out in Contested and undetermined below.
P4b, repurchase engine — not met, four votes to nil, on the criterion's own hard fail. Oscar has never repurchased a share as a public company: Item 5 of the FY2025 10-K reports issuer purchases as "None" [26], no repurchase line appears in the FY2023, FY2024 or FY2025 financing activities [22], no authorisation appears in any of the FY2021–FY2025 10-Ks, and the words "repurchase" and "buyback" do not occur once across the twelve earnings calls in the corpus. The share count moved the other way: 250,488 thousand shares outstanding at 31 December 2024 became 297,689 thousand a year later, up 18.8%, with 33.1 million of that from fourth-quarter 2025 conversion of $270.0 million of notes at an approximately $8.32 conversion price [27]. fit_features.share_count_trend.rising is true, with a 55.1% five-year compound rate. The framework's levered exception does not apply either: FY2025 adjusted FCF of $970.8 million against roughly $8,533.8 million of market value is an 11.4% yield against the exception's approximately 25% requirement, and the second leg — a demonstrated multi-year share-count reduction — fails outright.
The counter-fact: the company is not indifferent to dilution. It spent $34.4 million on capped call transactions in September 2025 specifically to limit dilution from the 2030 notes, capped at $37.46 a share. That is dilution management, not retirement. The absurdity check does not fire either: at the current price it takes 8.8 years of reported adjusted FCF to retire the float, against the framework's roughly three-year reference for a price that cannot survive.
P4c, dividend cover — not applicable, four votes to nil. Oscar has never declared or paid a cash dividend [28], the yield is 0.0% against the framework's approximately 4% materiality threshold, and the February 2026 credit agreement's negative covenants restrict distributions on equity interests [29]. No dividend forms part of the return case. Full treatment in Self-Help.
Diagnosis (P5) — met
Met, four votes to nil, probability 0.71 — carried from the adversarial trial rather than re-derived by the jury. Three independent judges returned 0.71, 0.66 and 0.72; the mean is 0.697, the spread 0.06, and the ruling was not contested. Reading order barely moved it: temporary-first briefs averaged 0.71 and permanent-first briefs 0.69, a gap of 0.02.
The temporary reading rests on the shape of the damage. The FY2025 hit was a margin event on an intact revenue base: a $646.4 million one-year swing of which 85.5% traces to risk-adjustment transfers stepping 393 basis points as a share of direct and assumed premiums [8], against revenue that grew 28% to $11.7 billion in the same year [21] and is guided up 61% for FY2026 [7].
The strongest surviving counter-fact is that the gap the framework hunts has closed. The run's two-scenario discounted model, weighted at the trial's 0.71, returns $19.99 a share; at the 30 March 2026 trough close of $10.85 that was a $9.14 gap, and at the 27 July 2026 close of $28.34 the price sits 41.8% above it. The independent check weakened this claim rather than confirming it outright: at a 10% discount rate the same model returns $26.01 and at a 5% steady-state operating margin it returns $29.57, essentially the current price. The supportable statement is therefore narrower — the price now embeds management's pre-event plan, not that the plan is unachievable. Management's 5% margin target dates from the June 2024 investor day [30] and was still described as live in August 2025 [6]. Both cases are presented in full in Damage Math.
Eight of the trial's quote checks failed on page attribution: the cited substance was verified verbatim one to four pages away in every case, so the judges treated them as pagination errors rather than fabrication and the ruling stood.
Instrument context (I1) — not verifiable
Not verifiable, four votes to nil. The docket's only entry asserts sixteen listed expiries out to 21 January 2028 (17.8 months) with 130,498 contracts of open interest in the two expiries beyond twelve months, and 30-day implied volatility of 86.6% against the framework's reference lines of up to approximately 55 acceptable and 60 to 70 elevated. Every one of those facts comes from web sources dated 27 July 2026 with no corpus page behind them, so the criterion is recorded as not verifiable and nothing is established either way — neither that qualifying long-dated options exist nor that they do not. The watchlist_only flag is not raised, because the framework attaches it only to fitting or lean-fitting outcomes. Instrument facts, as facts only, are in Clock.
What a 3x-in-3-years would require
The tally records no re-rating arithmetic: "Re-rating math unavailable because the applicable bar or normalized adjusted FCF is missing." Both inputs are not_computable in the deterministic feature file — yield_baseline, balance_sheet_class and adjusted_fcf all return no value — so the framework's target test cannot be stated from the tally. What follows is the same test built from the surviving claims' figures instead, labelled as such.
The applicable line is 8.5%, selected by the fortress classification derived from the filed balance sheet [25]. Mid-cycle normalised adjusted FCF is $586.3 million. At the line, that supports $6,898 million of market value — $23.06 a share on the 299,143 thousand shares filed at 31 March 2026, or 18.6% below the 27 July 2026 close. On normalised cash flow the framework's own bar sits below today's price rather than above it.
Running the test the other way: a 3x from $28.34 is $85.02, or $25,433 million of market value on the filed count. At the 8.5% line that requires $2,162 million of normalised adjusted FCF — 3.7 times the mid-cycle figure, 2.2 times the float-inflated FY2025 reading, and 9.7% of the FY2028 consensus revenue base of $22,226.6 million against the 3.3% the reconciled consensus proxy implies. Roughly three times the conversion rate consensus carries.
What consensus would have to concede is a much smaller number than that, and it is worth stating precisely: to reach a 10% adjusted yield by 2028 needs $743.6 million on the market capitalisation of record, only $4.6 million above the reconciled proxy, or $847.8 million on the filed share count — about $108.7 million more, which implies roughly a 4.6% operating margin on the 2028 revenue estimate against consensus's 4.11% and management's approximately 5% target [30]. The distance to the yield bar is small. The distance to a 3x is not the same question, and the arithmetic above is why.
The base rates make the timing point. Oscar's own listed history contains thirteen drawdown episodes of 35% or deeper in 1,357 trading days, roughly one every five months, with a median depth of -42.1% and a median 70 days from peak to trough. Twelve of the thirteen regained their prior peak, taking a median 170 days from the trough.
Source: derived from daily closes, 3 March 2021 to 27 July 2026, using a 35% swing-reversal segmentation; the current episode's peak and trough match the deterministic capitulation gauge.
The four prior episodes of 50% or deeper took between 166 and 1,772 days to regain their pre-drawdown peak, a median of 702. The current episode took 43 days from the 30 March 2026 trough to reclaim the $23.27 peak, six days after the Q1 2026 print — far faster than anything in the name's own record. That is the base-rate context for a framework whose instruments run 18 months and more: the re-recognition this pattern normally waits for has already been delivered, and the price is 21.8% above the peak the drawdown started from. This is arithmetic against the framework's reference lines, not a recommendation. The catalyst calendar is in Clock.
Contested and undetermined
P4a is contested, two votes to two, and the split runs cleanly along model families. Both claude seats recorded met; both codex seats recorded not met; the name-masked seat recorded not met. The two readings share every fact and differ on what "comfortably outlast without pivoting" requires.
The met reading. Debt is $445.0 million of principal — $410.0 million of 2030 notes at 2.25% and $35.0 million of 2031 notes at 7.25% — with nothing contractually due before a $35.0 million holder put on 30 June 2027 and no maturity before 2030. Cash interest paid in FY2025 was $12.8 million against $5,461.6 million of consolidated cash and investments [25]. On those numbers a pivot to debt paydown cannot be forced on this company at the moment repurchases would matter most, which is what the criterion asks.
The not-met reading. The cash that makes Oscar solvent is not available for capital allocation. Only $414.2 million of cash and investments sat outside the Health Insurance Subsidiaries at 31 December 2025, of which $14.7 million was restricted, and subsidiary excess capital over the minimum risk-based capital requirement fell from $734 million at the end of 2024 to approximately $315 million at the end of 2025 [31]. Parent cash fell further, to $279 million by 31 March 2026. The February 2026 revolving facility pledges substantially all assets as collateral and its covenants restrict distributions on and repurchases of equity interests, subject to limitations and exceptions, while requiring at least $200.0 million of liquidity plus undrawn commitments with at least $100.0 million in unrestricted cash at the company and guarantors [29]. Net of that reserve the free envelope is approximately $299.5 million, about 3.5% of market capitalisation, against roughly $853 million to add ten points to earnings per share.
The counter-fact that cuts toward the met reading: by the Q1 2026 call insurance-subsidiary capital and surplus had risen to approximately $1.7 billion including $809 million of excess capital, and total cash and investments to approximately $8.1 billion, so the December 2025 squeeze looks like a trough rather than a trend.
Because the tally records P4a as contested, no reading here is promoted to a verdict. The gate that produced the overall answer is U2, and it is not affected either way.
Nothing was recorded as cannot-determine. No criterion carries that verdict, so no named missing datapoint gates the answer. Two criteria are absent for structural reasons rather than uncertainty: P4c is not applicable because there is no dividend, and I1 is not verifiable because no citable option-chain source sits in the corpus. Both are stated above.
One further split worth naming, because it looks like disagreement and is not. The tally records no cross-family agreement on X1, X2, X3, X4 and S1. The codex seats labelled these checks "not hit" and the claude seats "not met" — the same finding under two labels, with identical evidence cited on both sides. The masked seat matched on all five.
Provenance
Source: the run's deterministic fit tally and refutation ledger, as recorded.
Two sentences on what that means. The verdict was reached by four jurors reading the same evidence dockets independently, two from each of two model families, plus a fifth juror shown the same dockets with the company's name removed — and the masked juror reached the same gate conclusions, which is why the run carries no prior-driven-risk flag. Every claim the verdict turns on was handed to a skeptic that recomputed the arithmetic from the cited pages: three claims came back weakened and are reported here in their weakened form, four could not be verified at all and carry no weight, and none was refuted.
The falsifier ledger
These are the standing conditions that would change the read. The ledger carries seventeen entries; several are the same test nominated by more than one tab, and each is reproduced exactly as recorded.
Framework templates.
- adjusted FCF or EBITDA declines where flat-or-better was underwritten
- revenue declines for a third consecutive year
- capital allocation pivots to debt paydown over repurchases
- share count inflects upward
- the industry repricing cycle fails to materialize where industry-wide mean reversion was underwritten
Name-specific, with thresholds and windows as recorded. Reproduced verbatim from the run's ledger, in the ledger's own wording.
Note on entry 11 of that block: the ledger recorded its source reference in raw internal form and it is reproduced unaltered. It resolves to the Q1 FY2026 Form 10-Q, page 37, which carries the eAPTC expiration, Program Integrity Rules and OBBBA discussion [32].
Three of the anchors those thresholds hang on are worth pinning to their pages: the approximately 20% risk-adjustment assumption and the 82.4% to 83.4% MLR guide are management's FY2026 guidance [33]; the 24% to 24.5% first-quarter accrual and the naming of the Wakely claims-based report as the determining data are from the Q1 2026 call [34]; and the $250 million to $450 million earnings-from-operations guide sits alongside the FY2026 revenue range [7].
Data gaps
The tally records sixty data-gap entries, most of them the same limitation reported independently by several tabs. Deduplicated, they are these.
Deterministic feature-file defects. fit_features.revenue_trajectory is built on the wrong income-statement line: it records FY2025 revenue of $28,593 thousand, which is Oscar's other-revenues line, not the $11,701,427 thousand of total revenue in the same filing [4]. The whole per-year series is unusable and every year in it is misaligned by roughly three orders of magnitude; the derived flags happen to survive the correction, since consecutive-decline-years of 0 and three-year-high-single-digit-decline of false are both still correct on the corrected series, but the inputs must not be quoted. fit_features.market_cap uses 262,388 thousand shares, the FY2025 weighted-average basic count from the earnings-per-share note, rather than shares outstanding — an understatement of 36.8 million shares against the 31 March 2026 balance sheet and of roughly 14% of market capitalisation, which flatters every yield computed on it; the U2 conclusion is unchanged under every convention, and this tab reports both bases. fit_features.adjusted_fcf, adjusted_fcf_yield, yield_baseline, fcf_stability, balance_sheet_class and float_retirement_years all return not_computable, because data/financials/cash_flow.json carries operating, investing and financing totals with no capex, stock-based compensation or acquisitions line. Every yield, stability and balance-sheet-class figure on this tab was rebuilt from the filed statements and is labelled a derivation, not a substitute. fcf_stability also returns an empty rolling five-year average, and even on the derived series only two adjacent windows exist — too few to characterise stability with confidence in either direction. float_retirement_years is not restated: on FY2025's float-inflated numerator the answer is 7.7 to 8.8 years and on the mid-cycle figure 12.7, but the FY2025 numerator is not repeatable.
Market, consensus and share data. No CapIQ consensus estimate rows exist in data/estimates (zero rows), so consensus positioning for X4 rests on the ratings distribution rather than on forward estimates; analyst counts, ratings and the mean target come from a market-data feed and dated web sources as at 28 July 2026, not from any filing. There is no consensus revision tape spanning the trigger event: the vendor momentum series reaches back only to 28 January 2026, so the FY2025 and FY2026 consensus levels immediately before and after the 22 July 2025 guidance cut cannot be read, and the numerator in the damage work is built on the company's own dated guidance record instead. The vendor free-cash-flow series is dominated by risk-adjustment payable build and settlement rather than owner earnings, so its implied forward yields of 46.2% for FY2026 and 22.6% for FY2028 are not underwritable and were not used; there is no direct adjusted-FCF consensus at all, and the FY2029 anchor rests on a single broker. Enterprise value is not separately derivable for an insurer of this structure, because consolidated cash and investments sit inside regulated subsidiaries against benefits payable and risk-adjustment payables; market capitalisation is used as the proxy throughout, with net parent debt of $152 million deducted in the discounted work.
Policy, calendar and market-share denominators. No 2027 weighted average rate increase has been disclosed as of 27 July 2026, so the forward leg of the repricing mechanism can be dated but not quantified. The City of Columbus v. Kennedy outcome and any renewal of the enhanced premium tax credits are undated, and the filing states the company cannot predict either; whether Congress reinstates the enhanced structure is not determinable from the corpus. No FY2026 fourth-quarter or full-year earnings date has been announced, so early February 2027 is the company's historical cadence rather than a scheduled event. No independent market-share data by state or rating area exists in the corpus: the 17%-to-30% footprint-share move is management-stated on the Q4 FY2025 call and uncorroborated by any filing, regulator document or third-party source [19]. Total individual-market enrolment appears only as management's characterisation of CMS data, so the denominator behind every national share calculation is second-hand, and the 2026 enrolment figures used in the durability work come from external published research. Oscar's 10-K names competitor categories rather than companies, so the peer set comes from the run's auto-generated screen plus each peer's own filings; Elevance's and UnitedHealth's individual-exchange membership are not disclosed in the sections read, so their share could not be quantified from primary sources — though Centene's 5.5 million Marketplace members across 29 states [35] and CVS's exit from every Public Exchange state Aetna operated in [36] are on the record.
Ownership, flow and instrument data. The short-interest feed returned zero rows, so the entire series used in the drawdown work is web-compiled FINRA data with no page citation. The Form 4 extract holds 365 transactions dated 2021 to 2023 and 2026 but none dated 2024 or 2025, so insider activity through the drawdown window cannot be established. Institutional holder-base changes are not resolvable: the ownership file records 13D and 13G filing dates with null holdings, and no 13F position history is staged. No index-deletion, fund-liquidation or block-trade disclosure appears anywhere in the corpus for the window, so forced selling can be neither evidenced nor ruled out. Implied volatility and option-chain facts come from web sources dated 27 July 2026 and carry no PDF page, which is why I1 is recorded not verifiable.
Documents absent from the corpus. Oscar's 22 July 2025 preliminary-results press release (Exhibit 99.1 to the 8-K) is not indexed — only the 8-K body [24] — so the revised guidance figures are cited from the Q2 FY2025 call, where management restates them verbatim. Centene's 1 July 2025 guidance-withdrawal release, the primary trigger document, is likewise absent and is sourced from Centene's own call. The 2026 credit agreement exhibit is parsed as page images with no extractable text, so the restricted-payments basket size and the exact leverage definitions could not be read; the covenant terms here come from the 10-K risk-factor summary. The November 2025 policy repricings are sourced to contemporaneous market reporting only.
Checked and absent, not unexamined. No share repurchase authorisation exists to assess, so there is no authorised-versus-executed gap to quantify — the finding rests on the absence of both. No buyback, repurchase or capital-return discussion appears anywhere in the Q3 FY2025, Q4 FY2025 or Q1 FY2026 transcripts. No 30-to-50-year operating history exists to test, since the company was founded in 2012 and the Marketplace itself dates from 2014, and the only macro shock in the record coincided with expanded subsidies and special enrollment periods, which confounds the test. And no corpus or web evidence was found of a technology or business model that would render individual-market health insurance obsolete over ten years: the substitution threat identified is competitive re-entry by withdrawn carriers, not technological displacement.
What This Tab Establishes
Oscar Health is a single-segment US health insurer selling ACA individual-market plans in 20 states, $11.7 billion of FY2025 revenue, 93% of premiums paid by CMS. It lists Class A common stock on the NYSE — the geography screen is clean. Market capitalisation is $7.44 billion against the $10 billion universe line, and misses on every share-count convention. No auto-OEM exposure, no China exposure, no consensus saturation.
What Oscar Sells
Oscar sells individual health insurance. A person without employer or government coverage buys an Oscar plan on a federal or state ACA marketplace, the federal government pays most of the premium as an advance premium tax credit, and Oscar pays that person's medical claims out of the premium. That is the whole economic engine; everything else the company describes is in service of it.
The company was incorporated in Delaware in 2012 as Mulberry Health [1] and describes itself as "a leading healthcare technology company built around a full stack technology platform," serving approximately 2.0 million effectuated members at 31 December 2025 [2]. Plans are sold in the five ACA metal tiers — Catastrophic, Bronze, Silver, Gold, Platinum — through exclusive-provider-organisation networks in most markets and HMO networks in a few [3]. Alongside the insurer, Oscar licenses its engagement software to other payors and providers as +Oscar, and in 2025 bought three small distribution assets — Lucie (a direct-enrolment platform, one of only 11 CMS-approved solutions), IHC Specialty Benefits (an individual-market brokerage), and Healthinsurance.org — to build a position in Individual Coverage Health Reimbursement Arrangements, the mechanism by which employers fund individual-market coverage instead of buying a group plan [4].
The revenue split shows how much of this is decoration. Oscar reports as one segment [5], and of FY2025's $11,701.4 million of total revenue, $11,469.9 million (98.0%) was insurance premium, $202.9 million (1.7%) was investment income on the float, and $28.6 million — 0.24% — was everything else, including +Oscar and the new brokerages [6].
Sources: FY2023 Form 10-K consolidated statements of operations for FY2021–FY2023 [7]; FY2025 Form 10-K for FY2024–FY2025 [8]; FY2026 guidance of $18.7–19.0 billion from the Q4 FY2025 earnings call [9].
Revenue has compounded at 58.8% a year since FY2021 and the company guides to another 61% in FY2026. Profit has not followed. Earnings from operations were negative in four of the five years, positive only in FY2024, and swung back to a $396.4 million loss in FY2025 as medical loss ratio rose 570 basis points to 87.4% and the risk-adjustment payable grew [10].
Sources: FY2023 Form 10-K for FY2021–FY2023 [11]; FY2025 Form 10-K for FY2024–FY2025 [12]. The FY2026 bar is derived: the FY2025 loss of $396.4 million plus the "nearly $750 million" year-on-year improvement management guided to at the midpoint [13].
The first quarter of 2026 came in well ahead of that path: revenue of $4.6 billion, up 53%, earnings from operations of $704 million, and net income of $679.0 million, or $2.07 per diluted share — the highest quarter in the company's history [14]. Individual-market earnings are heavily front-loaded within a policy year — members meet deductibles and out-of-pocket maxima as the year runs, shifting claims into the second half [15] — so a strong Q1 is a normal shape, not an annualisable run rate.
At 31 December 2025 Oscar employed approximately 2,305 people [16] — $5.1 million of revenue per employee, which is what a business that collects premiums and pays claims looks like, not what a technology licensor looks like.
The Universe Screen
Geography and instrument (U1) — clean. Oscar Health, Inc. is a Delaware corporation headquartered at 75 Varick Street, New York. Its Class A common stock, par $0.00001, is registered under Section 12(b) and listed on the New York Stock Exchange under OSCR; SEC file number 001-40154 [17]. This is a US operating company with a US primary listing — not an ADR, not a foreign private issuer, and with no Chinese domicile or China-listed parent. A dual-class structure sits behind it: Class B common stock exists but has no public trading market, and as of 31 January 2026 there were 12 holders of record of Class A and 11 of Class B [18]. The company has never declared or paid a dividend and does not intend to [19].
Market capitalisation (U2) — misses, and not narrowly. The deterministic feature file puts market capitalisation at $7.436 billion: 262,388,000 shares at the 27 July 2026 close of $28.34. That sits $2.56 billion, or 25.6%, below the $10 billion line.
The share count deserves a check, because the feature file uses the FY2025 weighted-average basic count, and holders of the 2031 convertible notes converted $270.0 million of principal into approximately 32.4 million Class A shares in the fourth quarter of 2025, with a further 0.7 million shares issued as an inducement payment [20]. Actual shares outstanding at 31 March 2026 were 263,552 thousand Class A plus 35,591 thousand Class B — 299.1 million in total [21]. Correcting for that raises the figure, and the line still holds.
Sources: shares outstanding from the Q1 FY2026 Form 10-Q balance sheet [22], weighted-average diluted shares from the earnings-per-share note [23]; closing price from the daily price series; the first row is fit_features.market_cap.usd. Derived: shares times close.
The widest reasonable measure — every share the diluted count contemplates, including the converts — reaches $9.35 billion, $655 million short. On the 299.1 million shares actually outstanding, the price would need to be $33.43 to clear the bar, 18.0% above the 27 July close. Third-party market-capitalisation trackers (accessed 28 July 2026, outside the filing record) put OSCR between $8.25 billion and $8.76 billion across June and mid-July 2026, consistent with the middle row. The 10-K's own cover states that non-affiliates held approximately $4.5 billion of common stock at 30 June 2025, at a $21.44 close [24]. Under no convention available in the record does Oscar clear $10 billion today. The company is a mid-cap, and the analysis below proceeds on that basis.
Where the Revenue Comes From
Two facts define the revenue base. The first is who actually pays. Oscar collects 93% of its premiums directly from CMS through the advance-premium-tax-credit programme and only 7% from members [25]. The economic customer is the federal government; the member chooses the plan but funds a small slice of it. That subsidy structure changed on 1 January 2026: the enhanced advance premium tax credits in place since 2021 expired at the end of 2025 and the pre-ARPA credit structure was reinstated, raising what members pay [26]. The size and pricing of the whole market moved with it, and the anatomy of that repricing belongs to Dislocation and Damage Math.
The second is geography — all of it domestic, and most of it in one state. Oscar offered coverage in 18 states for the 2025 policy year and expanded to 20 for 2026 [27]. Florida alone held 57.8% of members at the end of 2025.
Source: FY2025 Form 10-K, Membership by State [28]. Share of total is derived from the same table.
Three states carry 86.0% of the book. The year-on-year column shows how quickly the footprint moves: Texas grew from 141,000 members to 358,910 while Georgia fell from 379,680 to 218,746, and California and Connecticut went from 10,981 and 7,658 members respectively to zero [29]. The filing is explicit about why: "We elect to participate in a given individual market on an annual basis" [30]. Both the company and its competitors re-underwrite their state footprints every twelve months.
All operations, members, and regulated subsidiaries are in the United States. The investment portfolio consists of US Treasury and agency securities, corporate notes, and certificates of deposit [31].
Market Structure
Shape: a fragmented national market that is oligopolistic inside each state, with annual entry and exit. The individual market held a record 24 million lives after the 2025 open enrolment [32] and 23 million after the 2026 one [33], a decline of 5% that management called better than expected against its own 20–30% contraction estimate [34].
Against that denominator, the two largest carriers are identifiable from primary filings. Centene states plainly: "We are the largest Marketplace carrier, serving 5.5 million members across 29 states as of December 31, 2025," under the Ambetter brand [35] — roughly 24% of a 23 million-life market. Oscar served 3.4 million members as of 1 February 2026, about 15% of the same market [36], and describes itself as "the largest carrier fully dedicated to the individual market" [37]. Inside its own footprint the concentration is much higher: management put Oscar's share across the states it serves at 17% in 2025, rising to 30% in 2026 [38].
Oscar's own 10-K names the competitor set generically rather than by company: "plans offered by national carriers, regional carriers, Medicaid-focused insurers offering Health Insurance Marketplaces products, and local Blue Cross plans" [39]. The filing also states that "the identity of our principal competitors for members and providers varies by market and geography" — which is the accurate description of a market whose structure is set state by state, not nationally.
The direction of travel is toward fewer national carriers, not more. Peer filings make this concrete rather than anecdotal:
CVS Health: "The Company exited the states in which Aetna operated on the Public Exchanges effective January 2026" [40]. It had booked a $448 million premium deficiency reserve on the individual exchange line in Q1 2025 [41], after $270 million on the same line in Q3 2024 [42].
The Cigna Group: Individual and Family Plan premiums fell from $5,088 million in 2023 to $3,951 million in 2024 to $3,371 million in 2025 — down 33.7% over two years [43].
Oscar's CEO framed the 2026 open enrolment in exactly these terms: "We took decisive actions with disciplined pricing, distribution, and product strategy to go after profitable growth as competitors pulled back or exited the market" [44]. That is the mechanism behind the 17%-to-30% footprint share step. The counter-fact sits in the same sentence: carriers left because the line lost money, and Oscar lost $443.2 million in 2025 in the same market [45]. Share taken from retreating competitors and share taken on superior economics look identical for a year or two and are not the same thing.
Regulatory entry barriers are real and named. Each Health Insurance Subsidiary must obtain and maintain regulatory approval in every state where it sells; state insurance departments hold broad administrative authority over rate and product filings, network adequacy, licensing, and financial reporting; the subsidiaries are subject to statutory risk-based capital minimums under the NAIC Risk-Based Capital For Health Organizations Model Act; and insurance holding-company acts require prior regulatory approval before any person acquires 10% or more of the voting securities [46]. Premium rates must be approved by state and federal regulators, and risk adjustment transfers money between carriers based on the relative morbidity of their books [47]; the ACA's minimum medical-loss-ratio provision forces rebates to members when the threshold is missed [48].
The counter-evidence on that barrier is Oscar itself. A company founded in 2012 cleared every one of those requirements and reached 3.2 million members by March 2026 [49]. The regime is a filter on capital and compliance capability, not on entry as such.
Capital intensity is low in the physical sense and moderate in the regulatory sense. Oscar's Health Insurance Subsidiaries held aggregate statutory capital and surplus of approximately $1.0 billion at 31 December 2025, down from $1.2 billion a year earlier [50] — $11.7 billion of revenue supported on roughly $1.0 billion of regulated surplus, an 11.7-times ratio. Property, equipment and capitalised software, net, stood at $94.2 million against total assets of $9,289.6 million at 31 March 2026, or 1.0% [51]. The binding constraint on growth is statutory surplus and the regulator's tolerance, not plant.
Operating history is short. Incorporated 2012, first ACA plans when the law created the direct-to-consumer channel in 2014 [52], IPO on the NYSE in March 2021 [53] — thirteen years of operating history and five as a public company, against a framework anchor of thirty to fifty years for the kind of durability conviction Durability has to test. The product is essential in the ordinary sense — people need medical coverage — but the demand for this product is created and sized by a federal subsidy that Congress adjusted at the end of 2025 and could adjust again [54].
First-Pass Exclusions
Auto OEM (X1) — not applicable. Oscar is classified under SIC 6324, Hospital and Medical Service Plans, reports a single insurance segment, and derives 98.0% of revenue from health insurance premium [55]. No vehicle manufacturing, no automotive supply exposure.
China dependence (S1) — absent. The words "China" and "Chinese" do not appear anywhere in the FY2025 Form 10-K. Every member, every regulated subsidiary, and every licensed market is in the United States: 18 states in 2025, 20 in 2026 [56]. Revenue exposure to China: 0%. Asset exposure: 0% — the investment portfolio is US Treasury and agency securities, corporate notes, and certificates of deposit [57].
Consensus-saturated positioning (X4) — not on the multiple, borderline on the chart. On multiple-to-sales, Oscar is the second-most expensive name in its own competitive set, though the absolute level is nothing like a story-stock multiple.
Sources: FY2025 total revenue from each company's Form 10-K — Oscar $11,701m [58]. UnitedHealth $447,567m [59]. Elevance $199,125m [60]. CVS $402,067m [61]. Cigna $273,854m [62]. Molina $45,426m [63]. Centene $194,777m [64]. Market caps derived from 27 July 2026 closing prices and latest reported share counts.
At 0.64 times sales — 0.72 times on the 299.1 million shares actually outstanding — Oscar carries a higher price per dollar of revenue than every peer except UnitedHealth, and four times Centene's 0.16. Managed-care revenue is largely premium pass-through, so these ratios say more about expected margin than about growth optimism; the exclusion Ruchir's framework aims at is the ten-to-twenty-times-sales story stock, and Oscar is not that.
Sell-side positioning does not look saturated either. Eleven analysts carry a consensus of Hold; the mean target price is $24.20 against a $28.34 close, so the stock trades 17% above where the sell side marks it, and the rating distribution as at 28 July 2026 is three strong buys, seven holds and one strong sell, with no plain buys. Consensus is behind the price, not driving it.
Source: consensus analyst estimates as at 28 July 2026 — mean target $24.20, eleven ratings (three strong buy, seven hold, one strong sell). Analyst estimates do not appear on any filing page; the $28.34 comparison close is the 27 July 2026 daily price.
The chart shape is the one place where the darling test bites. Oscar closed its first day of NYSE trading at $34.80 on 3 March 2021, reached an all-time closing high of $36.77 a week later, fell to $2.15 in 2022 — a 94% decline — recovered to $23.28 in May 2024, sold off to $10.85 on 30 March 2026, and closed at $28.34 on 27 July 2026. That is 161% above the March 2026 trough, 89% above the 2026 open of $14.97, and 22.9% below the 2021 high.
Source: daily closing prices, March 2021 to 27 July 2026, as reported. The 2026 series runs to 27 July.
The relevant fact for the framework is not the multiple but the timing: the point of maximum fear in this name was 30 March 2026 at $10.85, and the price has since gone up 2.6 times. Whether that leaves a dislocation to buy is measured on Dislocation and Yield, not here.
Promotional CEO (X2) and structural decline (X3) belong to Self-Help and Durability. Two facts surfaced in this tab bear on them and are recorded rather than argued: management's public framing leans heavily on the technology and AI narrative while 98.0% of revenue is insurance premium and 0.24% is platform and brokerage revenue [65]; and revenue has risen every year since FY2021, so the framework's three-consecutive-years-of-decline disqualifier is not engaged on the reported record [66].
Limitations
The fit_features.revenue_trajectory series is built on the wrong income-statement line. It reports FY2025 revenue of $28.6 million, which is Oscar's Other revenues line, not the $11,701.4 million of total revenue in the same filing [67]. Every figure in this tab uses the filed total-revenue line. The feature file's conclusions on that field happen to survive the correction — consecutive_decline_years of 0 and three_year_hsd_decline of false are both still right on the corrected series — but the inputs are not usable and are recorded as a gap.
fit_features.market_cap.usd of $7.436 billion uses the FY2025 weighted-average basic share count, which understates shares outstanding by 36.8 million versus the 31 March 2026 balance sheet. The universe conclusion is unchanged under every alternative, so the feature figure is carried forward as the record with the alternatives shown above.
Bottom line
Oscar fell 53.4% from $23.27 on 19 September 2024 to $10.85 on 30 March 2026, in three legs on two dated triggers: an industry-wide risk-adjustment shock announced on 1 July 2025, and the expiry of the enhanced ACA premium tax credits. Traded volume peaked at 15.5 times its pre-peak median in July 2025. The stock closed at $28.34 on 27 July 2026 — 161% above the low and 22% above the peak the drawdown started from. The dislocation happened; it is no longer available.
The drawdown, quantified
Peak — 19 Sep 2024
Trough — 30 Mar 2026
Depth, peak to trough
Close — 27 Jul 2026
Source: daily closing prices as reported; drawdown peak, trough, and depth per the run's deterministic capitulation gauge (fit_features.capitulation_gauge.drawdown), which measures the deepest peak-to-trough move in the trailing two years.
The fall took 557 calendar days — 381 trading sessions — which is not the shape of a single repricing. A near-identical prior peak of $23.28 on 21 May 2024 sits just outside the gauge's window and would give a depth of 53.4%, so the measurement does not hang on the choice of September 2024. Against the post-IPO high of $36.77 on 10 March 2021, today's $28.34 is 22.9% lower; against the drawdown's own starting peak, it is 21.8% higher.
Source: month-end closing prices from the run's daily price history, as reported.
Three legs down, two of them on events
The decline is separable into a drift, two event legs, and two rebounds. The distinction matters to the framework, which treats a quiet 10–20% slide as drift rather than a moment.
Source: derived from the run's daily price and volume history; volume multiple is the 20-day average volume at each leg's end date divided by the 2.68 million-share median daily volume in the 180 calendar days before the 19 September 2024 peak, the same denominator the capitulation gauge uses.
The first 21.2% of the fall, from 19 September to 5 November 2024, came on 33 sessions at 1.2 times normal volume with no company disclosure attached — drift. The 5–7 November pair is different: the stock lost 25.6% across the 2024 election result and Oscar's third-quarter release the following morning [1], on roughly four times normal daily turnover.
The trigger
The dated adverse event is 1 July 2025, and it did not originate at Oscar. Centene announced that evening that its first read of 2025 Health Insurance Marketplace data from Wakely — an independent actuarial firm that aggregates market growth and morbidity information for individual-market carriers — covering about 72% of its membership implied market morbidity materially above its risk-adjustment assumptions. Centene later described the announcement as flagging "earnings pressure of $1.8 billion in 2025 as a result of a change in Marketplace risk adjustment transfer assumptions" [2].
The read-across was immediate and graded by exposure to the individual market. On 2 July 2025 Centene closed 40.4% lower, Molina 22.0% lower, Oscar 18.7% lower on 78.0 million shares — 29 times its pre-peak median daily volume — Elevance 11.5% lower, UnitedHealth 5.7% lower and Cigna 4.2% lower. Oscar fell 37.4% in the thirteen sessions from $21.44 on 30 June to $13.42 on 18 July 2025.
Oscar's own confirmation came three weeks after the price move. On 22 July 2025 it filed an 8-K announcing preliminary second-quarter results and "revising its full year 2025 outlook" [3]. Management set out the mechanism on the August call: the Wakely data through 30 April indicated "a meaningful market-wide increase in morbidity in 2025," impacting all carriers and lifting morbidity by mid- to high single digits across Oscar's markets [4]. In accounting terms it landed as an incremental $316 million increase to the 2025 risk-adjustment payable, recognised year-to-date in the second quarter, taking second-quarter MLR to 91.1% [5].
The size of the guidance move is the anchor for the Damage Math tab. Oscar entered 2025 guiding to earnings from operations of $225 million to $275 million on revenue of $11.2–11.3 billion [6]. The 22 July revision replaced that with a loss from operations of $200 million to $300 million on revenue of $12.0–12.2 billion [7] — a $500 million swing at the midpoint on a one-year operating-earnings line, against a $2.1 billion fall in market value over the same thirteen sessions on a constant 262.4 million-share count. The full year came in at a $396.4 million loss from operations and a $443.2 million net loss, $646 million below the original midpoint [8]. The FY2025 10-K attributes the 5.7-point MLR rise to "an increase in average market morbidity that resulted in an increase in the net risk adjustment transfer accrual, as well as higher utilization that was not fully offset by risk adjustment" [9].
A second, distinct trigger drove the third leg. The enhanced premium tax credits that underwrite individual-market affordability were scheduled to lapse at the end of 2025; management framed them as the difference between a farmer on $60,000 paying $75 a month and $300 a month for coverage [10]. On 10 November 2025, with the Senate advancing a shutdown-ending deal that did not extend the credits, Oscar fell 17.6% in one session on 49.2 million shares; on 24 November, on a report that a two-year extension would be proposed, it rose 22.3% on 58.2 million shares. Those two sessions are policy repricings, not company events, and no Oscar filing accompanies either — they are sourced here to contemporaneous market reporting rather than to a primary document.
The fear gauge
Median daily vol before peak (M sh)
Peak 20-day avg vol (M sh)
Spike multiple
20-day avg vol at price trough (M sh)
Source: fit_features.capitulation_gauge.volume_spike — maximum 20-day average volume in the peak-to-trough leg divided by the median daily volume in the 180 calendar days before the peak; derived from the run's daily price history.
Volume spiked 15.47 times. The 20-day average peaked at 41.5 million shares in the window ending 29 July 2025, against a pre-peak median of 2.68 million. That is emotion-priced selling by any reasonable reading — but the date is the part that matters.
Source: derived from the run's daily traded-volume history; pre-peak median daily volume was 2.68 million shares.
The capitulation sits at the July 2025 event, when the price was $13.84 and 40.5% below the peak — not at the $10.85 low eight months later. By 30 March 2026 the 20-day average had fallen to 6.8 million shares, 2.5 times the pre-peak median. The final seven sessions into the low took the price from $13.30 to $10.85, an 18.4% fall, on daily volumes of 8.3, 9.5, 6.8, 6.5, 5.1, 8.2 and 8.1 million shares — every one of them between 1.9 and 3.5 times the pre-peak median. The final leg was an orderly repricing on ordinary volume, not a second capitulation. On 27 July 2026 the 20-day average is 4.3 million shares, 1.6 times the pre-peak median — back to ordinary.
Who was selling
Reported short interest is the clearest positioning evidence, and it tracks the July 2025 event precisely. The run's own short-interest feed returned no rows for OSCR, so the series below comes from FINRA's semi-monthly reported short-interest filings as compiled by public market-data aggregators, cross-checked at two settlement dates against a second compiler; it is not a corpus document and carries no page citation.
Source: FINRA semi-monthly reported short-interest filings, as compiled by public market-data aggregators; percent-of-float figures vary by compiler because float definitions differ.
Short interest went from 12.0 million shares at the 30 September 2024 settlement — around 7% of float — to 62.5 million shares at the 15 July 2025 settlement, a 118% jump in a single fortnight and roughly 35% of float, the highest reading in the series. That is the same fortnight the volume spike peaked. It then fell steadily: 49.6 million by 31 August, 25.1 million by 31 December 2025, and 26.5 million at the 31 March 2026 settlement, about 11% of float. So the price trough was reached with short positioning already down two-thirds from its peak and roughly at its pre-shock level, and with turnover back near normal. Whoever marked the March 2026 low, it was not a crowded short book being pressed or a forced liquidation.
Direct evidence on forced or anchored sellers is thin. No index deletion, fund liquidation, or block-sale disclosure appears in the run's corpus for the drawdown window. The one large sponsor exit on record predates the drawdown entirely: Alphabet sold 6.5 million shares at $8.08 on 17 August 2023, thirteen months before the peak. Thrive Capital, Joshua Kushner's vehicle, amended its Schedule 13D on 13 November 2024, inside the first leg, and T. Rowe Price and Vanguard filed 13G amendments on 14 November 2025 and 27 March 2026 respectively, both inside the third leg; the run's ownership index records these filings but not their contents, so the direction of each change is unverified here.
The insider record has a hole and a signal. The run's Form 4 extract contains no transactions at all dated in 2024 or 2025 — 365 transactions covering 2021 to 2023 and 2026, none in between — so no claim can be made about insider trading through the fall itself. What the record does show, dated, is the other side: between 14 May and 1 July 2026, with the stock between $21.74 and $31.65, insiders sold 3.82 million shares for $109.4 million under 10b5-1 plans, of which CEO Mark Bertolini sold 2.45 million shares for $70.7 million across 25–30 June 2026 and co-founder Mario Schlosser 1.11 million for $32.4 million. Separately, a company announcement dated 18 November 2024 records a purchase of Oscar shares by Bertolini's foundation, inside the first leg and two sessions before the stock rose 12.7% on 19 November 2024. The buying is at the bottom; the selling, in size, is into the recovery.
Estimates against price
Dated consensus snapshots exist in the run's CapIQ extract only for FY2027 and FY2028, and only back to 28 January 2026. Within that window the sequencing is unambiguous, and it is the framework's signature: consensus was marked up while the price was still falling.
Source: consensus mean estimates from the run's CapIQ estimates extract (data/sp/estimates.json, revision snapshots at 180, 90 and 30 days and current), paired with the closing price on each snapshot date.
Between the 28 January and 28 April 2026 snapshots, consensus FY2027 EPS rose 45% (from $1.00 to $1.45), FY2028 EPS rose 75% ($1.08 to $1.88), and FY2027 revenue rose 39% ($14.1 billion to $19.6 billion). The price on 28 January was $14.87 and on 28 April $18.04 — but on 30 March, between those two marks, it printed $10.85, 27% below the January level. The estimate cycle turned up first; the price made its low afterwards and then ran past the estimates, gaining 65% between 28 April and 26 June against a 16% rise in the FY2028 number.
On the way down, no dated consensus history is available before January 2026, so the July 2025 sequencing has to be read from company guidance rather than from the sell side. There the order is clear enough: the stock fell 37.4% between 30 June and 18 July 2025, and Oscar's own guidance revision was published on 22 July [11]. The price moved on the industry read-across three weeks before the company confirmed the number.
Where the price sits now
The recovery ran ahead of, then with, the fundamentals. Oscar guided 2026 to revenue of $18.7–19.0 billion, MLR of 82.4–83.4% and earnings from operations of $250–450 million on 10 February 2026 [12], and reaffirmed it at the Raymond James conference on 2 March 2026 [13] and again on 8 June 2026 [14]. The stock still fell to $10.85 three weeks after that first reaffirmation. What ended the fall was delivery: on 6 May 2026 Oscar reported first-quarter MLR of 70.5%, 490 basis points better year over year, and $704 million of earnings from operations [15], with net income of $679 million, or $2.07 per diluted share, on 3.2 million members [16]. Consensus for that quarter was $1.10; the stock rose 10.6% on the day and a further 47% over the following seven weeks, to $29.16 on 24 June 2026.
At $28.34 the stock is 161% above its low, 22% above the peak the drawdown started from, 12% below its 2 July 2026 fifty-two-week high of $32.18, and 23% below its March 2021 post-IPO high. Short interest is 8.4% of float, turnover is 1.6 times its pre-shock median, and insiders have sold $109 million into the move. The conditions the framework's entry test looks for — a recent adverse event, a fear-priced volume spike, a price anchored to a cut it has not yet outgrown — were all present between July 2025 and March 2026. None of them is present on 27 July 2026.
One arithmetic note that carries into Fit: at $28.34 on the 262.4 million shares the feature file uses, market capitalisation computes to $7.44 billion. The share count is the FY2025 weighted-average basic figure; the fourth-quarter 2025 weighted-average basic count was 283.2 million [17], which would put the figure near $8.0 billion. Either way it sits below the $10 billion universe line, and it did so at every point in this drawdown.
What would change this read: a fresh dated adverse event — the June 2026 Wakely report landing worse than the pricing assumption, or a 2027 policy change to the individual market — that takes the stock down on a volume spike of the July 2025 order. The drawdown described here is history; the temporary-versus-permanent question about the damage it priced belongs to Damage Math.
The Bottom Line
Oscar's 2025 problem cost $646 million of guided operating earnings in a single year, about 85% of it a step-up in risk-adjustment transfers from 14.5% to 18.5% of direct premiums. At the March 2026 trough the market took out $12.42 a share against $3.28 to $5.72 of plausible NPV damage — a gap of roughly $2.0 billion to $2.7 billion. The judges put the probability the impairment is temporary at 0.71. At $28.34 that gap has closed.
The Near-Term Hit
The trigger has a clean paper trail. On 4 February 2025, reporting FY2024, Oscar introduced a 2025 outlook of $11.2 billion to $11.3 billion of revenue, a medical loss ratio of 80.7% to 81.7%, and earnings from operations of $225 million to $275 million [1]. It reaffirmed that outlook across every metric on 7 May 2025 [2].
On 22 July 2025 the company pre-announced preliminary second-quarter results and revised the full-year outlook [3]. The revised guide: revenue of $12.0 billion to $12.2 billion — higher — and a loss from operations of $200 million to $300 million [4]. Revenue guidance went up $850 million at the midpoint while the earnings line moved $500 million the other way. The problem was margin, not volume.
The year finished worse than the revision. FY2025 total revenue was $11,701.4 million, the loss from operations $396.4 million, and diluted loss per share $1.69 [5], on a medical loss ratio of 87.4% [6]. The fourth quarter alone carried a 95.4% MLR and a $333.7 million operating loss [7].
Sources: FY2025 outlook [8]; July 2025 revision [9]; FY2025 actual loss from operations of $396.4 million [10]; FY2026 outlook of $250 million to $450 million of earnings from operations [11].
The arithmetic of the numerator: guided FY2025 operating earnings of +$250 million at the midpoint against a reported −$396.4 million is a $646.4 million swing in one fiscal year — roughly 5.5% of that year's revenue.
The longer-dated hit is measurable too. At its June 2024 Investor Day, management set out a 2027 target of at least 20% revenue CAGR, roughly 5% operating margin, and EPS of $2.25 or better [12]. Asked in August 2025 whether those targets survived, Bertolini said the forecast was not changing and "5% is still our target," while conceding a revision might follow the pricing season [13]. Consensus now carries FY2027 normalised EPS of $1.51 and a 2.69% operating margin, reaching $2.21 only in FY2028 — the target level arrives about a year late, on a share count 21% larger.
What the Price Did
Over the same window the equity fell further than the earnings line, and then more than recovered.
Sources: closes from the daily price series, as reported; share counts are Class A plus Class B outstanding at the nearest filed balance-sheet date — 30 Sep 2024 [14], 30 Jun 2025 [15], 31 Mar 2026 [16].
Three moves matter.
The trigger leg. From $20.45 on 1 July 2025 to $13.62 on 21 July 2025, the shares fell 33.4% in thirteen sessions, all of it before Oscar's own pre-announcement, on which the shares then rallied 7.9%. Turnover peaked at 82.7 million shares on 22 July 2025, against a median of 2.68 million a day in the 180 days before the drawdown began. The deterministic gauge records a volume spike of 15.5x on its own definition (peak 20-day average volume in the peak-to-trough leg over the pre-peak 180-day median), which the anatomy in Dislocation covers in full.
The full drawdown. Peak close $23.27 on 19 September 2024 to trough close $10.85 on 30 March 2026: −53.4% per share over 557 days. Market capitalisation fell less — $5,753 million to $3,246 million, −43.6% — because the share count rose 21% in between. That increase is not free-float creep: 33.2 million Class A shares were issued on conversion of convertible notes during 2025, retiring $270.4 million of carrying value into equity [17].
Side by side. Consensus FY2025 EPS finished at −$1.69 against a company guide that had implied positive operating earnings; the price fell 53.4%. That is the shape of the pattern the framework hunts. What follows is the arithmetic on whether the shape was real.
On enterprise value. For an insurer the usual EV bridge misleads. Oscar closed FY2025 with $2,774 million of cash, $1,216 million of short-term and $1,471 million of long-term investments against $1,455 million of benefits payable, a $2,588 million risk-adjustment transfer payable and $430 million of long-term debt [18]. Almost all of that cash sits inside regulated subsidiaries backing reserves. Parent-level cash was $279 million at 31 March 2026 [19] against $431 million of long-term debt [20] — net parent debt of about $152 million, under 2% of the current market capitalisation. Enterprise value and market capitalisation therefore move together here, and market capitalisation is used throughout.
One numeric caveat. The deterministic feature file records a market capitalisation of $7,436 million at the 27 July 2026 close, using 262,388 thousand shares. That figure is the FY2025 weighted-average basic share count, not shares outstanding; the filed balance sheet shows 261,851 thousand Class A plus 35,838 thousand Class B outstanding at 31 December 2025, rising to 299,143 thousand at 31 March 2026 [21]. On the filed count the current market capitalisation is $8,478 million. Every valuation figure below uses the filed count; the discrepancy is recorded as a data gap rather than silently reconciled.
Risk Adjustment Step-Up
One line did the damage. Oscar's premium revenue is direct and assumed policy premiums less risk-adjustment transfers — the federal payment a plan makes when its members score healthier than the market.
Sources: 2023-2025 derived from direct policy premiums, assumed premiums and risk adjustment transfers as filed [22]; 2026 is the company's guided assumption of approximately 20% [23].
The filed table: direct plus assumed premiums of $6,647.7 million in 2023, $10,511.7 million in 2024 and $14,077.9 million in 2025, with risk-adjustment transfers of $950.7 million, $1,526.4 million and $2,596.8 million [24]. That is 14.30%, 14.52% and 18.45%. Management states the 2025 figure as approximately 18.5%, "a 390 basis point increase year-over-year" [25].
The decomposition. Hold the 2025 premium base at $14,077.9 million and apply the 2024 transfer rate of 14.52%: transfers would have been $2,044.3 million rather than $2,596.8 million — $552.5 million less expense. Against a total shortfall of $646.4 million versus the February guide, the risk-adjustment rate step accounts for 85%, leaving about $93.8 million for utilisation, mix and everything else.
The step arrived in three instalments and each one was a re-estimate, not a claim: a $316 million increase to the 2025 risk-adjustment payable in Q2 [26], and a further $275 million accrual increase in Q4 after an updated report showed Oscar's book skewing healthier than the broader market [27]. Oscar's own 10-K states the general case: actual risk-adjustment transfers "have in the past materially differed, and could materially differ in the future, from our assumptions" [28].
Repricing Mechanism
ACA individual coverage is a one-year contract repriced annually with state approval, so the corrective path is procedural rather than commercial. Oscar refiled 2026 rates in states covering approximately 99% of membership at a weighted average increase of about 28%, and priced market contraction at the high end of a 20% to 30% range following the enhanced-subsidy sunset [29] [30].
The whole pool repriced, not Oscar alone. Centene bridged $2.4 billion of 2025 pre-tax earnings to Marketplace morbidity shifts against its prior forecast [31]. Molina repriced its Marketplace book at 2026 rate increases averaging 30%, ranging 15% to 45%, and cut its county footprint by 20% [32].
Two things about that mechanism deserve to be stated precisely, because they cut in opposite directions.
The risk-adjustment level does not revert. Management guides approximately 20% of direct premiums for 2026, above 2025's 18.5% and well above 2024's 14.5% [33]. What corrects is the pricing for it: the 82.4% to 83.4% MLR guide already embeds a 20% transfer rate and still produces $250 million to $450 million of operating earnings [34].
And the first data point after repricing is strong. Q1 2026 revenue was $4.6 billion with an MLR of 70.5% and utilisation largely in line with expectations [35]; earnings from operations were $704 million, net income $679 million or $2.07 a diluted share, membership 3.2 million, and full-year guidance was reaffirmed at every metric [36].
That quarter needs its qualifiers. The 10-Q states that deductibles and out-of-pocket maxima "shift more costs to us in the second half of the year" [37]. Risk adjustment was accrued at 24% to 24.5% of premium in the quarter against the 20% full-year assumption — Blackley attributes the level explicitly to seasonally low Q1 claims rather than to a cushion — and prior-period development was a net $68 million favourable, comprising $150 million of favourable claims run-out against $85 million of adverse state development, with offsetting favourable states not recognised [38].
Sources: 1Q26 reported [39]; consensus quarterly path from the driver-level estimate file, 1Q26 vintage 5 May 2026 and 2Q26-4Q26 vintage 14 July 2026.
Consensus carries the seasonality explicitly: $141 million in Q2, −$80 million in Q3 and −$416 million in Q4, summing with the reported $704 million to $350 million for the year — the exact midpoint of guidance. The Q1 print beat the pre-release consensus of $435 million by $269 million, and the sell side has so far let the beat sit in the guide rather than raise the year.
Two-Scenario NPV
The question the framework asks is narrow: under conservative assumptions, how much of the net present value of future cash flows does this event plausibly destroy, and how does that compare with what the price destroyed. What follows is deliberately simple, so it can be recomputed line by line.
Assumptions, stated. Discount rate 12% on equity — a single-line regulated insurer with no meaningful parent leverage and a demonstrated 4-point swing in annual MLR. Owner earnings are earnings from operations less $25 million of interest, taxed at 21% in cash from 2026 (conservative: Oscar's FY2025 income tax expense was $5.6 million on a $437.3 million pre-tax loss, and the loss carryforwards shelter several years of the forecast). Cash flows are taken at each year-end and discounted from July 2026, so t equals 0.5, 1.5, 2.5 and 3.5 years. Terminal value from 2030 grows at 3%. Net parent debt of $152 million is deducted. Excess subsidiary capital of $809 million is not credited. The share count is 299,143 thousand. Figures below are rounded to the nearest $1 million from an unrounded series, so recomputation from the printed numbers can differ by a dollar or two of millions.
The forecast path. 2026 and 2027 operating income come from consensus at the 14 July 2026 vintage: $349.8 million and $530.5 million. The scenarios separate at 2028.
Source: temporary scenario; 2026-2028 operating income is the driver-level consensus mean at the 14 July 2026 vintage, 2029 grown 12%; owner earnings and present values derived as described above.
Scenario T, temporary. The pool reprices and Oscar holds the 3.48% operating margin consensus carries for 2028 ($772.7 million on $22,226.6 million of revenue). Terminal value is $664 million times 1.03 divided by 0.09, or $7,598 million, discounted to $5,110 million. Explicit-period present values of $242 million, $337 million, $445 million and $447 million bring the total to $6,581 million; less $152 million of net parent debt gives $6,429 million, or $21.50 a share.
Scenario P, permanent. The margin never improves past the 2.69% consensus carries for 2027 and stays there: 2028 operating income of $598 million and 2029 of $646 million. Terminal value $5,612 million, discounted to $3,775 million; total present value $5,025 million, less net debt, or $16.29 a share.
A cross-check on Scenario T without any model. Take the market's own pre-event valuation as the unimpaired NPV: $5,753 million at the 19 September 2024 peak. Push the entire stream out by one year at 12% and it falls to $5,137 million. Add the $270.4 million of debt converted to equity and divide by 299,143 thousand shares: $18.07 a share, or 22.3% below the pre-event $23.27. Two independent routes put the temporary case at $18 to $22 a share.
And the plan. Running the same model at the 5% operating margin management targeted for 2027, applied to the 2028 consensus revenue base, gives $8,846 million of equity value, or $29.57 a share.
Source: derived as set out above from driver-level consensus at the 14 July 2026 vintage and the June 2024 Investor Day margin target [40].
At the trial's 0.71 probability the impairment is temporary, the probability-weighted value is 0.71 × $21.50 plus 0.29 × $16.29 = $19.99 a share, or $5,979 million. On the more conservative cross-check construction of the temporary case it is 0.71 × $18.07 plus 0.29 × $16.29 = $17.55 a share.
The Damage Gap
Measured against the pre-event $23.27, the two scenarios destroy $1.77 to $6.98 of per-share value; probability-weighted, $3.28 (model basis) to $5.72 (cross-check basis). At the 30 March 2026 trough of $10.85, the price had destroyed $12.42.
The gap at the trough was therefore $6.70 to $9.14 a share — $2,004 million to $2,733 million on 299,143 thousand shares, or 38% to 46% of the probability-weighted value. That is the mispricing the framework looks for, and on this arithmetic it was there.
It is no longer there. At the 27 July 2026 close of $28.34 the price sits 42% to 61% above the probability-weighted value and 32% above the temporary scenario's $21.50. It sits just under the $29.57 that falls out of the model when management's original 5% operating margin is achieved on the 2028 revenue base. On these assumptions, the current price already carries the plan working.
The stated multiples are consistent with that reading: 25.8 times FY2026 normalised EPS of $1.098, 18.7 times FY2027 at $1.515, and 12.8 times FY2028 at $2.208, all at the 14 July 2026 consensus vintage.
What would move the answer: a lower discount rate. At 10% rather than 12% the temporary scenario is worth materially more, because roughly 78% of its value sits in the terminal value. Anyone underwriting a 5% margin as the steady state rather than 3.5% reaches a different conclusion — which is exactly the argument the trial adjudicated.
Consensus Record and Gaps
The vendor revision history has a real limitation, and it matters for the numerator. The estimate file's momentum series reaches back 30, 90 and 180 days from 27 July 2026 — that is, to 28 January 2026. It does not span the July 2025 guidance cut. The pre-event consensus path in this tab is therefore reconstructed from the company's own guidance record, which is primary and dated, not from a consensus tape.
What the vendor window does show is the recovery leg, and it is instructive.
Source: consensus values at the 180-day and current vintages of the estimate file; share price from the daily series ($14.87 to $28.34), as reported.
Over that six-month window FY2028 consensus EPS moved from $1.075 to $2.208, up 105%, and FY2028 revenue from $15,058 million to $22,227 million, up 48%. The share price rose 91%. Price and out-year estimate moved together. That is the opposite of the anchoring the framework hunts, where the price stays pinned to a cut near-term number while the out-years recover.
Three other gaps are worth stating plainly.
The deterministic feature file's revenue series is wrong for this purpose. It reports FY2025 revenue of $28.6 million and a 2023 decline of 67%, because it has picked up the "services and other" line rather than total revenue; the filed total revenue is $11,701.4 million, up 28% year over year [41]. The file's conclusion — no three-year high-single-digit revenue decline — happens to hold on the correct series, since total revenue rose in every year from 2021 to 2025 and 2026 is guided up 61% at the midpoint [42]. The structural-decline exclusion does not hit on this evidence.
The consensus free-cash-flow series is not usable as an earnings proxy here. It shows $596 million for FY2025, $3,435 million for FY2026 and $441 million for FY2027 — a 46% forward "yield" on the current market capitalisation in one year and 6% the next. That volatility is the risk-adjustment payable building and settling, not owner earnings; the payable alone stood at $2,588 million at year-end 2025 [43]. The adjusted-yield treatment sits in Yield; this tab uses operating earnings.
The adjusted free-cash-flow feature is not computable at all on this run, so no yield-based cross-check on the NPV work is available.
Temporary Versus Permanent
The temporary-or-permanent question was tried by two opposing briefs, each cited to the corpus, and ruled on by three judges reading blind and in different orders. Both cases are set out here at their strongest; the ruling is the report's, not this tab's.
Sources for the temporary case: FY2024 results and adjusted EBITDA of $199.2 million [44]; the 2022 net loss of $606.3 million [45]; the near-$750 million 2026 swing, paid membership and capital position [46] [47]; peer repricing [48] [49]; the member transition proceeding as expected and driven mostly by members who never made a payment [50].
Sources for the permanent case: 98% of revenue from ACA-regulated plans and 97% of direct policy premiums APTC-subsidised [51]; 93% of premiums earned directly from CMS [52]; risk-adjustment transfers materially differing from assumptions [53]; the quarterly payable increases of $316 million, $130 million and $275 million [54] [55] [56]; second-half cost seasonality [57]; the Street split and $24.20 target [58]; the non-renewal of the Cigna+Oscar arrangement and exit from the small-group market [59]; larger competitors pricing more competitively and obtaining better unit-cost economics [60].
The ruling. The judges put the probability the impairment is temporary at 0.71, with a mean of 0.697 and a spread of 0.06 across the three seats — 0.71, 0.66 and 0.72. Reading order moved the answer by 0.02 (temporary-first mean 0.71, permanent-first mean 0.69). The ruling is recorded as not contested.
Two honesty notes on that ruling. The judges logged nine citation-verification failures, eight of them against the temporary brief — mostly page-attribution errors where the quoted substance was verified one to four pages away, plus two exhibits resting on the vendor estimate files that were unverifiable under the judges' page-only access and were given no weight. The drawdown figures used by both briefs were identical and treated as uncontested. This tab cannot override the ruling and does not attempt to; the diagnosis probability the report carries is 0.71.
What flips it. The judges' conditions converge on a small set: FY2026 operating income below $250 million or an intra-year cut; the first claims-based 2026 Wakely report in Q2 showing market morbidity worse than pricing, with risk adjustment holding at or above 24% of direct premium rather than normalising to the guided 20%; risk transfer stepping above 20% again for 2027 or a second consecutive year of double-digit corrective rate filings; and effectuated membership below roughly 2.6 million by year-end 2026. Confirming the other way: FY2026 closing inside the 82.4% to 83.4% MLR guide with no Q4 true-up above $100 million. The timing of those tests sits in Clock.
Bottom line
On the framework's basis — free cash flow minus stock-based compensation minus the five-year average of acquisition spend — Oscar's FY2025 adjusted FCF is $970.8 million, a 13.1% yield on the market capitalization of record. Almost all of it is float: the risk-adjustment payable owed to CMS rose $1,029.4 million in the same year, more than the entire adjusted figure. Stripped of working-capital movement, FY2025 adjusted FCF is negative $488.2 million.
The deterministic feature file could not compute this tab's core numbers
fit_features.adjusted_fcf, adjusted_fcf_yield, yield_baseline, fcf_stability,
balance_sheet_class and float_retirement_years all return not_computable for this run. The
stated reasons are "no annual free cash flow or operating cash flow plus capex" and "debt or cash
missing for FY 2025" — the structured cash-flow feed carries operating, investing and financing
totals but no capex, stock-based compensation or acquisitions line.
Every figure below is therefore built from the filed cash-flow and balance-sheet statements themselves, page-anchored, using the framework's definition unchanged. Two further defects in the feature file are recorded rather than silently corrected:
revenue_trajectoryreads Oscar's Other revenues line ($28.6 million in FY2025), not total revenue ($11,701.4 million) [1]. The revenue series in that feature is unusable.market_cap.nativeof $7,436.1 million uses 262.388 million shares — the FY2025 weighted average basic count [2], not shares outstanding. At 31 March 2026 Oscar had 263.552 million Class A plus 35.591 million Class B shares outstanding, 299.143 million in total [3], which at the same $28.34 close is $8,477.7 million — 14.0% higher. Every yield below is shown on the feature file's basis first, with the filed-share-count reading alongside.
The adjustment, line by line
Oscar has made no acquisitions in any of the seven years on file: no acquisition line appears in the FY2021, FY2022 or FY2025 cash-flow statements [4][5][6]. The five-year average acquisition deduction is therefore zero, and the whole of the adjustment is stock-based compensation.
All figures $ millions. Adjusted FCF = reported FCF − stock-based compensation − 5-yr average acquisition spend; derived from the filed cash-flow statements. Sources: FY2025 10-K, Consolidated Statements of Cash Flows [7]; FY2022 10-K [8]; FY2021 10-K [9].
The stock-based compensation deduction removes $87.7 million in FY2025 and $159.7 million in FY2023 [10] — 8.3% and 53.6% of reported FCF respectively. In FY2023, when reported FCF was already negative, the stock-based compensation add-back was the difference between a $297.7 million cash outflow and a $457.4 million one. Across the full seven years the adjustment removes $625.2 million, and the size of the deduction has been falling in absolute terms since FY2023 as the share-based expense base has come down.
The reported cash is float
The FY2025 adjusted figure of $970.8 million is larger than any operating result Oscar has ever posted. The company lost $443.2 million that year [11]. The reconciliation is working capital: changes in assets and liabilities contributed $1,459.0 million to the $1,094.9 million of operating cash flow, of which the increase in the risk-adjustment transfer payable alone was $1,029.4 million [12] — 106% of the adjusted FCF the yield is computed on.
That payable is money owed to CMS. It stood at $2,587.7 million at 31 December 2025, and the final market risk-score report that fixes it arrives from CMS in June of the following year [13]. Management says as much in its own liquidity discussion: the timing of risk-adjustment transfers "can be significant" and can swing operating cash flow in any given period [14].
Working capital = the sum of the changes-in-assets-and-liabilities lines in the operating section; ex-working-capital = adjusted FCF less that sum. Derived from filed cash-flow statements: FY2025 10-K [15]; FY2022 10-K [16].
On this decomposition Oscar has generated positive adjusted cash before working capital exactly once in six years — $1.6 million in FY2024. The pattern continued into 2026: first-quarter operating cash flow of $2,619.0 million included $1,993.1 million from the increase in payables to CMS [17], and payables to CMS reached $4,723.2 million by 31 March [18].
The counter-fact worth holding against this: float that grows with a growing book is genuinely usable cash while the book grows, and Oscar's membership rose 56% year-on-year to approximately 3.2 million at 31 March 2026 [19]. Insurance float is a real funding source. What it is not is cash a company can repurchase stock with — it is a regulated liability with a dated settlement.
The yield, three ways
FY2025 adjusted yield
3-year average adjusted yield
Applicable reference line
Adjusted FCF from filed cash-flow statements [20], divided by the market capitalization of record ($7,436.1 million at the 27 July 2026 close of $28.34).
Current. $970.8 million ÷ $7,436.1 million = 13.06%. On the 299.143 million shares actually outstanding at 31 March 2026 [21], the same numerator over $8,477.7 million gives 11.45%.
Three-year average. FY2023 through FY2025 adjusted FCF of −$457.4 million, $840.5 million and $970.8 million averages $451.3 million. Against $7,436.1 million that is 6.07%; against $8,477.7 million, 5.32%. The five-year average (FY2021–FY2025) is $259.8 million, or 3.49%.
The company's own baseline. Computing adjusted FCF against each fiscal year-end's own market capitalization gives a series with no baseline to speak of:
Same-year shares from the filed statements of operations, times the last close on or before each fiscal year-end. Oscar listed in March 2021, so FY2019 and FY2020 have no market price. Derived from company filings and the daily price series.
The sign flips in three of five years and the range spans 68 percentage points. There is no stable ~3.5–4% baseline here, so the fortress signature the framework looks for — a formerly steady yield that suddenly jumps toward the bar — is absent by construction. The direction is the opposite of a jump: the 13.06% current reading sits below the five-year median of 23.5%, because the share price rose 161% from the 30 March 2026 close of $10.85 to $28.34. At the March low the same FY2025 numerator would have computed to 34.1%. Roughly 21 percentage points of adjusted yield have been priced away in four months.
Which bar applies
The balance-sheet class selects the reference line, and fit_features.balance_sheet_class returns
unknown. Computing it from the filed balance sheet at 31 December 2025:
- Long-term debt $430.1 million; cash and cash equivalents $2,774.2 million [22].
- Net debt = $430.1m − $2,774.2m = −$2,344.1 million. Adding the $1,216.5 million of short-term and $1,471.0 million of long-term investments takes it to −$5,031.5 million.
- EBITDA = loss from operations of −$396.4 million plus depreciation and amortization of $28.9 million = −$367.5 million [23].
The classification rule keys on net debt first: net debt at or below zero is fortress, regardless of EBITDA. Oscar classifies fortress, which selects the ~8–9% reference line (8.5% at the spec's midpoint).
That classification deserves a plain caveat rather than a footnote. Of the approximately $8.1 billion of cash and investments Oscar held at 31 March 2026, $279 million sat at the parent company; the insurance subsidiaries held roughly $1.7 billion of capital and surplus, of which $809 million was described as excess [24]. The rest is regulated statutory capital and money owed to CMS and to providers. The net cash that produces the fortress classification is policyholder and regulator money, not shareholder money. A reader who takes the harsher view and applies the 10% default line is doing something defensible, so both positions are shown.
Yields on the market capitalization of record ($7,436.1 million). Reference lines are the framework's balance-sheet-scaled bars: 8.5% fortress, 10% default. Derived from filed cash-flow statements [25] and the mid-cycle workings below.
Stated as arithmetic: 13.06% on FY2025 adjusted FCF against the 8.5% fortress line clears it by 456 basis points; against the 10% default line, by 306 basis points. On the filed share count those margins narrow to 295 and 145 basis points. The three-year average of 6.07% sits 243 basis points short of the fortress line and 393 short of the default line — and on the filed share count, 318 and 468 short.
Normalized mid-cycle yield
Oscar is cyclical in the specific way the framework's healthcare-insurance pattern describes: the swing factor is the annual pricing-versus-cost-trend cycle, not volumes. FY2025 was the trough of that cycle — medical loss ratio 87.4% against 81.7% the prior year [26], a $396.4 million operating loss driven by market morbidity that pushed the risk-adjustment accrual up [27][28]. FY2026 is the repriced recovery: first-quarter MLR 70.5% [29], operating earnings of $704.1 million against $297.1 million a year earlier [30]. Neither year is mid-cycle, and neither is annualizable — management guides full-year 2026 operating earnings to $250–450 million on $18.7–19.0 billion of revenue [31], which puts the remaining nine months at negative $254 to negative $454 million, because MLR is lowest in the first quarter and highest in the fourth [32].
The assumptions, stated so they can be replaced.
- Window. FY2023–FY2026E, one complete underwriting cycle at scale. FY2019–FY2022 is excluded: Oscar was sub-scale, ran heavy quota-share reinsurance that made revenue non-comparable, and posted operating margins of −86.9% (FY2020), −29.6% (FY2021) and −14.9% (FY2022) that describe a start-up, not a cycle.
- Revenue base: $18,850 million, the midpoint of the $18.7–19.0 billion guided for 2026 [33]. This is itself a share-gain year — membership up 56% partly on auto-assigned members picked up from a competitor that left the marketplace [34], achieved despite the sunset of the enhanced premium tax credits [35] — so it is arguably a high base for a shrinking individual market rather than a neutral one.
- Mid-cycle operating margin: 3.5%, in a 2%–5% band. The anchors: Oscar's own 2027 target of ~5% set at the June 2024 Investor Day [36] and reaffirmed on the Q2 2025 call ("5% is still our target") [37]; the realized FY2023–FY2026E average of −1.2%; and consensus operating margins of 3.2% for 2027 and 4.1% for 2028. The 3.5% base sits below management's target and between the two market-derived anchors.
- Below the operating line. Interest expense $21.5 million (the Q1 2026 run rate of $5.4 million annualized) [38]; a 5% effective cash tax rate, against a $3,294.4 million accumulated deficit [39] that shelters cash tax (FY2025 cash income tax paid was $17.5 million on $11.7 billion of revenue) [40]; depreciation and amortization $30 million; capex $50 million, between FY2025's $36.4 million and consensus 2028's $68.8 million.
- Working capital: zero. At mid-cycle the CMS payable neither builds nor unwinds. This is the assumption that does the most work, and it is the reason the normalized figure is a fraction of the reported one.
- Stock-based compensation is not deducted twice. Under the framework's definition, reported FCF adds SBC back inside operating cash flow and the adjustment then removes it; starting from GAAP net income, which already expenses it, the two cancel.
The arithmetic. 3.5% × $18,850m = $659.8m operating earnings; less $21.5m interest = $638.2m pre-tax; less 5% tax = $606.3m; plus $30m depreciation less $50m capex = $586.3 million of mid-cycle adjusted FCF. On $7,436.1 million that is 7.88%; on $8,477.7 million, 6.92%.
At the 2% margin floor the figure is $317.7 million and 4.27%; at management's own 5% target it is $854.9 million and 11.50% (10.08% on the filed share count).
So: the mid-cycle base case sits 62 basis points short of the 8.5% fortress line and 212 short of the 10% default line. Only management's full 5% target clears the default line, and on the filed share count even that lands at 10.08% — at the line, not through it.
The consensus check
fit_features.consensus_forward_yield computes forward yields of 46.2% for 2026, 5.9% for 2027
and 22.6% for 2028 on the market capitalization of record. Those numbers oscillate by 40
percentage points because the vendor's free-cash-flow line is modelling the same CMS payable
timing, not an earnings path. Three specifics make the FCF consensus unusable as a yield anchor:
- The vendor reports no contributor count on the free-cash-flow, cash-from-operations or capex lines, while revenue carries nine estimates and EBITDA seven.
- The lines do not reconcile: 2026 cash from operations of $2,969.2 million less $38.0 million of capex is $2,931.2 million, against a free-cash-flow mean of $3,435.4 million. For 2027 the same subtraction gives $659.9 million against a free-cash-flow mean of $440.7 million.
- For FY2025, now actual, the consensus free-cash-flow mean was $596.3 million against reported FCF of $1,058.5 million — a 44% miss on a completed year.
The closest usable proxy is consensus GAAP net income converted on the same zero-working-capital basis used above (net income plus depreciation less capex; SBC is already expensed inside net income):
Consensus GAAP net income, capex and free cash flow are vendor consensus means as of 28 July 2026; depreciation held near the FY2025 run rate of $28.9 million. Yields on $7,436.1 million. Vendor FCF yields per fit_features.consensus_forward_yield.
On that proxy consensus does not clear the bar until 2028: 5.35% in 2026, 7.38% in 2027, and 9.94% in 2028 — the last still 6 basis points under the 10% default line and 144 basis points above the 8.5% fortress line. On the filed share count the 2028 figure is 8.72%, which clears the fortress line by 22 basis points and misses the default line by 128.
The mean-reversion underwrite, since consensus sits below the bar in the near years. The path does not require reversion — it requires the repricing already in force to hold. The mechanism is specific and dated:
- Repricing is done, not hoped for. Oscar planned the market on the assumption of no enhanced-subsidy extension and built its products around it [41], and its first-quarter reserves sit on morbidity assumptions consistent with that pricing [42]. First-quarter MLR came in 490 basis points better year-on-year and administrative expense ratio at 15.2%, the lowest in company history [43].
- Operating leverage is the second lever. Revenue rises from $11.7 billion to a guided $18.7–19.0 billion [44] while the fixed administrative base grows far more slowly; that is the 2–4 points of the margin bridge management attributes to scale [45].
- What consensus would have to concede. To reach 10% on the feature-file market cap by 2028, normalized FCF must reach $743.6 million — $4.6 million above the current consensus-implied proxy. To reach it on the filed share count, $847.8 million is needed, $108.8 million above consensus, which is an operating margin of about 4.6% on the 2028 revenue estimate against consensus's 4.1%. To clear the 8.5% fortress line on the filed share count, consensus need concede nothing at all.
Probability. I put roughly 55% on the adjusted forward FCF yield clearing the applicable 8.5% fortress line within three years on the market capitalization of record, and about 35% on clearing the 10% default line. The arithmetic behind those: consensus already implies 9.94% for 2028 on the feature-file share count and 8.72% on the filed count, so the fortress line needs no estimate revision on one basis and a modest one on the other; the 10% line needs an operating margin roughly half a point above consensus, which is inside management's own target but has never been delivered. The probability is not higher because three of the six years on file show the underwriting cycle turning against Oscar, and because a 2027 rate cycle that overshoots — the mirror of 2025 — would reset the base. The dominant risk to the estimate is the price itself, not the business: at $10.85 in March 2026 every one of these thresholds cleared comfortably; at $28.34 the margin for error is 3 percentage points of operating margin.
FCF-to-revenue conversion
Total revenue per the filed statements of operations: FY2025 10-K [46]; FY2023 10-K [47]; FY2021 10-K [48]. Adjusted FCF and its ex-working-capital variant derived from the filed cash-flow statements [49][50].
Read on the headline line, conversion is stable-to-slightly-down: 9.2% of revenue in FY2024, 8.3% in FY2025. Read ex-float — the line that matters for whether cash can be returned — the trend is improving and still below zero: −87.1% of revenue in FY2020, −29.5% in FY2021, −15.6% in FY2022, −4.5% in FY2023, 0.0% in FY2024, −4.2% in FY2025. Five years of steady improvement, one year of reversal on the cost-trend miss, and no year yet meaningfully above the line.
That trend is improving rather than deteriorating, which is the direction the framework's levered exception and buyback flywheel both require. What it has not yet done is establish that a positive ex-float number is the normal state rather than a single year's crossing. Whether any of this cash would reach shareholders is a separate question, taken up in Self-Help — no repurchase or capital-return discussion appears in the Q3 2025, Q4 2025 or Q1 2026 calls.
Limitations and what would change this read
- The five-year average acquisition deduction is zero because no acquisition line appears in any filed cash-flow statement in the window. Oscar's forward-looking statements do reference integrating strategic acquisitions [51], and the three Marketplace Subsidiaries were acquired [52], so the zero reflects the absence of a separately disclosed cash line rather than an absence of corporate development.
- The mid-cycle figure moves about $190 million of operating earnings — $179 million after tax — per percentage point of operating margin, which is 2.4 points of yield on the feature-file market cap. A reader who prefers a 2027–2029 window, or who assumes the individual market contracts and takes the revenue base to $16 billion, gets $491.5 million and 6.6% at the same 3.5% margin.
- Two things would change the read materially. If the CMS payable begins to unwind — the mirror of 2025 — reported FCF turns sharply negative while nothing about the business changes, and the headline yield inverts. If Oscar posts a full year of positive ex-float adjusted FCF at the guided revenue base, the normalization ceases to be an assumption and becomes an observation, and the base case moves toward the upper end of the 4.3%–11.5% band.
- The share-count basis moves every yield on this page: the 14.0% gap between the feature file's weighted-average count and the filed shares outstanding is worth 161 basis points on the FY2025 reading and 75 basis points on the three-year average.
The year-10 question
Oscar clears the framework's revenue-decline disqualifier: total revenue compounded from $488 million in 2019 [1] to $11.7 billion in 2025 [2] with no back-to-back down year. The conviction sources behind that growth are thinner. Approximately 98% of revenue sits inside one federal statute [3], 93% of premiums arrive from one payer and every carrier elects participation annually [4], and the operating record runs 14 years against a $3,294.4 million accumulated deficit [5].
Where the conviction would have to come from
The framework's year-10 gate does not ask whether a business is growing. It asks what would keep revenue and adjusted free cash flow higher a decade out even if management changed, competitors attacked, and the cycle turned. Five sources supply that: market structure, regulatory entry barriers, capital intensity, essentialness, and operating history. Each is tested below against Oscar's own record rather than against the sector's reputation.
Sources: FY2025 Annual Report (Form 10-K), Item 1 Business and Item 1A Risk Factors [6], [7], [8], Note 16 Statutory Regulations [9] and the loss-history risk factor [10].
Market structure
Oscar names its own competitive set: "plans offered by national carriers, regional carriers, Medicaid-focused insurers offering Health Insurance Marketplaces products, and local Blue Cross plans" [11]. That is four categories of rival, not a duopoly. Page 8 states the participation rule plainly: "We elect to participate in a given individual market on an annual basis" [12]. Participation is an annual election for every carrier in the market, Oscar included. There is no franchise, no licence scarcity, no installed base that has to be replicated.
The share record confirms what that structure implies. At the 2021 IPO, Oscar reported "an estimated 10% market share across the counties we serve in the Individual market" and described itself as the third largest for-profit national insurer in the segment [13]. In February 2026 management reported that "Oscar's market share across our footprint increased from 17% in 2025 to 30% in 2026" [14]. A 13-point share move inside twelve months is the opposite of the stability the gate looks for. It reads as a gain now; the same mechanism prices it back out when the carriers who withdrew return. Management attributes the gain directly to that withdrawal: it went after growth "as competitors pulled back or exited the market" [15].
Sources: FY2021 10-K [16]; FY2022 10-K [17]; FY2023 10-K [18]; FY2024 10-K [19]; FY2025 10-K [20]; Q4 FY2025 call for the February 2026 figure [21]. Footprint share is management's own measure and is reported only for 2020, 2025 and 2026.
The 2023 dip is worth reading closely. Membership fell 10%, and the filing explains why: "we requested that regulators limit our membership growth in Florida above a certain threshold so that total membership across all markets would be within our previously announced target range of 900,000 to 1,100,000" [22]. Oscar had to ask a regulator to cap its own growth because it could not fund the statutory capital. That is capital intensity acting as a brake, not as a wall against rivals.
Regulatory entry barriers
The barrier is real and specific. To sell insurance in a jurisdiction a carrier "must establish an adequate provider network and demonstrate our ability to perform or delegate utilization management and other administrative functions", and Marketplace participation carries "in some cases an annual recertification process" [23]. State solvency regimes add minimum statutory capital and restrictions on dividends up to the parent [24].
What the regime blocks is a garage startup. What it does not block is Centene, Elevance, UnitedHealth, Cigna, Molina and every Blue licensee, all of whom already hold the licences, the networks and the surplus. Oscar is itself the proof that the barrier is passable: a company founded in 2012 [25] reached roughly 2.0 million members by 2025 without owning a single structural asset the incumbents lacked. The framework's bank-and-insurer barrier argument works when the regulator's protection is asymmetric in the incumbent's favour. Here it is symmetric among the carriers who matter.
Capital intensity
Aggregate statutory capital and surplus across the Health Insurance Subsidiaries was approximately $1.0 billion at 31 December 2025, against $1.2 billion a year earlier [26]. Set against $11.7 billion of revenue, that is a regulatory reserve, not a replacement-cost moat. Nothing here resembles a network, a right-of-way, a licence area or an asset base a challenger would have to spend a decade rebuilding. The capital requirement rises with membership rather than falling with scale: the filing warns that growth "could trigger further increased capital requirements, including RBC, that could substantially exceed the net income generated by the health plan or in the new market" [27]. This conviction source does not apply.
Essentialness
Health coverage is essential. Subsidised individual coverage bought on an exchange is a policy construct, and the two are not the same claim. During 2025 approximately 97% of Oscar's direct policy premiums were subsidised by advance premium tax credits, up from 92% in 2024 [28]. The demand is real; its price to the member is set by Congress.
There is a genuine countercyclical argument on the other side, and it should be stated. When employer coverage or Medicaid falls away, the individual market absorbs the lives: Oscar's 2024 growth was driven partly by special enrollment following Medicaid redeterminations, and management frames the current inflow as entrepreneurs, gig workers, part-time employees and early retirees for whom group insurance no longer works [29]. Demand for the category through a recession is plausibly stable or better. Demand for Oscar's share of it is a separate question, and the annual-election structure answers it unfavourably.
Operating history
"The year ended December 31, 2024 was the first time since our inception in 2012 that we achieved profitability on either a consolidated net income or Adjusted EBITDA basis." Oscar did not repeat it in 2025, and the accumulated deficit stood at $3,294.4 million at year-end [30]. Fourteen years of operating history, one profitable year in it, against a framework reference of 30 to 50 years and survival through cycles. The ACA Marketplace itself has existed only since 2014 and has never been through a US recession in its present form.
The structural threats
Regulatory reversal, already delivered
This is not a hypothetical. Approximately 98% of Oscar's revenue in both 2025 and 2024 "was derived from sales of health plans subject to regulation under the ACA" [31]. The enhanced advance premium tax credits that lifted marketplace enrollment from 2021 "expired at the end of 2025 and the pre-ARPA APTC structure has been reinstated" [32]. Separately, the One Big Beautiful Bill Act signed on 4 July 2025 limits APTC eligibility for certain populations, and CMS program-integrity rules issued 25 June 2025 tighten eligibility verification, shorten open enrollment and suspend certain special enrollment periods, with several provisions under a nationwide court stay [33].
The size of the sensitivity is now observable rather than modelled. Management's own planning range was a 20% to 30% contraction of the individual market on subsidy expiry, and it priced 2026 at the high end of that range [34]. Congress did not extend the credits: they lapsed at the end of 2025 and the pre-ARPA structure took their place [35]. Measured on effectuation rather than plan selections, management put the contraction at 5% as of February and expected the reduction to reach the lower end of that 20% to 30% range by year-end [36].
For the year-10 question the number that matters is not the contraction itself but what it demonstrates: a single expiring tax provision removed on the order of a fifth to a quarter of Oscar's entire addressable market in one enrollment cycle, with no change in the product, the technology or the competition. That provision is reset by Congress each session, in both directions. A business whose addressable market can move 20% on a legislative calendar does not have a year-10 revenue floor that can be underwritten with very high conviction.
Customer concentration
"For the year ended December 31, 2025, 93% of premiums were earned directly from CMS and 7% were from our members" [37]. Ninety-three per cent of cash receipts come from one counterparty, which is also the regulator, the rule-writer and the party that sets the subsidy. Concentration on the cost side is milder but present: AdventHealth, HCA Healthcare and Baptist Health South Florida together took approximately 24% of total allowable medical costs in 2025 [38].
Competitive re-entry
The 13-point footprint share gain came as competitors pulled back or exited the market, on management's own account [39]. Centene, the largest carrier in the market, described itself as serving 5.5 million Marketplace members across 29 states at 31 December 2025 [40] and told investors six weeks later it expected roughly 3.5 million by the end of the first quarter of 2026, down from about 5.0 million in December [41]. The market did not consolidate around a protected position; it shrank and reshuffled, and Oscar reshuffled into the gap.
Quantifying the reversal is straightforward because the arithmetic is symmetric. Oscar guides to $18.7 billion to $19.0 billion of 2026 revenue [42], roughly 61% above 2025, on a footprint share of 30% against 17%. If footprint share reverted to the 2025 level as withdrawn carriers returned, and premium rates held, the same footprint would support revenue on the order of $10.6 billion to $10.8 billion — below 2025's $11.7 billion, and reached without any deterioration in Oscar's execution. That is the year-10 exposure in one line: a plausible 43% revenue reduction from a competitive event that requires nothing more than rivals filing rates.
Substitution, technology, and the margin question
Nothing in the record — Oscar's filings, the transcripts, or the peer disclosure — names a technology that makes Oscar's product obsolete. Nobody is disintermediating the ACA risk pool; the plan has to be underwritten by a licensed carrier. Two adjacent points do matter.
The first is that Oscar's own differentiators are not defensible in the framework's sense. The +Oscar technology platform serves nearly 0.6 million client lives on Campaign Builder, against roughly 2.0 million insurance members [43], and the ICHRA thesis Oscar has built its growth case on appears verbatim in Centene's filing as its own opportunity [44]. Lower administrative cost from automation is a real advantage and a genuine one; it is also execution, and execution carries no year-10 protection.
The second cuts the other way, and is the strongest structural point in Oscar's favour. The ACA's minimum medical loss ratio provision requires insurers to rebate to members when medical costs fall below the specified threshold [45]. Underwriting margin in this market is capped by statute, so there is no fat margin here for a new entrant to attack. The answer to "is anyone's margin an opportunity" is largely no, because the regulator already took it. The corollary is that the same rule caps Oscar's own margin compounding, which is why the year-10 free-cash-flow question turns on volume rather than price.
Risk adjustment as a recurring drag
The federal risk-adjustment programme is a zero-sum transfer between carriers in each state. Oscar has been a substantial net payer: risk transfer ran approximately 18.5% of direct premiums in 2025, up 390 basis points year on year [46], and the net risk adjustment payable rose from $1,493.6 million to $2,531.6 million during 2025 [47]. Because Oscar attracts a younger, healthier book than the market average, it pays into the pool structurally rather than episodically. That is not a threat to survival, but it permanently removes roughly a fifth of gross premium from the revenue line and makes the reported figure dependent on an estimate that CMS does not settle until June of the following year [48].
The disqualifier check
The framework disqualifies a company whose revenue has declined at a high-single-digit rate for three consecutive fiscal years after a long existence. fit_features.revenue_trajectory records consecutive_decline_years: 0 and three_year_hsd_decline: false. The flag does not fire.
The feature file's underlying series requires a correction. Its revenue values are Oscar's "Other revenues" line, not total revenue: $28.6 million for 2025, $20.6 million for 2024, $21.4 million for 2023 and $64.9 million for 2022 match the filed "Services and other" and "Administrative services revenue" figures exactly [49], and that line is defined in the filing as brokerage, enrollment-platform, market-education, +Oscar platform, virtual-card rebate and sublease income [50]. Total revenue for the same years was $11,701.4 million, $9,177.6 million, $5,862.9 million and $3,963.6 million [51]. The flag reaches the right answer on the wrong series; both series are shown below so the reader can check it either way.
Source: fit_features.revenue_trajectory, reproduced exactly as computed. The series corresponds to the filed Other revenues line, not total revenue [52], as reported in the Consolidated Statements of Operations [53].
Sources: FY2021 10-K, Consolidated Statements of Operations [54]; FY2023 10-K, Consolidated Statements of Operations [55]; FY2025 10-K, Results of Operations [56].
On the filed numbers there is one down year in seven, 2020 at $462.8 million against $488.2 million in 2019, a 5.2% decline caused by a change in ceded reinsurance rather than by lost business [57]. No consecutive declines, and nothing close to the three-year high-single-digit pattern. Structural decline is checked and absent. Oscar is a growing business inside a market that has just contracted, which is a different condition and is treated as such above.
FCF consistency
fit_features.fcf_stability returns an empty rolling series and not_computable with the reason "fewer than five consecutive adjusted-FCF years"; fit_features.adjusted_fcf is likewise empty, because the structured cash-flow feed carries operating cash flow but not capital expenditure, stock-based compensation or acquisitions. The framework's consistency test cannot be run from the deterministic file. It can be run from the filings, and the result is more informative than a gap line, so it is set out here with its workings and labelled as a derivation rather than a feature.
All figures $ millions. Adjusted FCF = operating cash flow − capital expenditure − stock-based compensation; no acquisition line is disclosed in the cash-flow statements for these years, so the framework's five-year average acquisition deduction is zero. Derived from the Consolidated Statements of Cash Flows in the FY2022 [58], FY2023 [59] and FY2025 [60] 10-Ks.
Source: derived from the Consolidated Statements of Cash Flows, FY2022 to FY2025 10-Ks [61].
Three readings come out of that table.
Two of the six years are negative, and the swing runs from −$457.4 million in 2023 to +$970.8 million in 2025. Only two consecutive positive years exist in the whole record, 2024 and 2025. The rolling five-year average — the framework's actual test — can be computed for exactly two windows: FY2020 to FY2024 averages $100.2 million, FY2021 to FY2025 averages $259.8 million. A 159% move between two adjacent rolling windows is the definition of an unstable base, and two windows is too few to call it anything else.
The composition matters more than the level. In 2025 the increase in the risk adjustment transfer payable was $1,029.4 million against operating cash flow of $1,094.9 million [62]. Essentially the entire year's operating cash flow was money owed to CMS and not yet paid. Oscar paid $1,611.7 million of prior-year risk transfers during 2025 and closed the year owing $2,587.7 million gross [63]. Strip that single line out and adjusted free cash flow is negative in five of six years and cumulatively −$817 million over 2020 to 2025.
The fair counter is that this is float, and float is a legitimate feature of an insurer's cash generation: a carrier whose premium base grows holds a permanently larger payable, so the build is not purely a borrowing. The honest boundary is that the risk-adjustment payable is settled in cash roughly a year in arrears against a CMS report received each June [64], so it recurs as a net benefit only while premiums keep growing. The first quarter of 2026 shows the same pattern at a larger scale, $2,619.0 million of operating cash flow on $679.0 million of net income [65]. Cash generation here is a function of growth, not a separable property of the business.
On the framework's own carve-out — an occasional negative episode every five to eight years is healthy in insurance and banking, because it is the price of the good years — the pattern does not fit. The negative years are 2021 and 2023, two years apart, and the loss years are 2019 through 2023 plus 2025. That is not an underwriting cycle around a stable base; it is a company that reached a positive base for the first time in 2024 and has not yet held it for three consecutive years. The mechanism is also different: 2025's loss came from a market-wide morbidity misestimate and the resulting risk adjustment true-up [66], which is a forecasting error of the kind the framework treats as temporary and is examined in Damage Math, not a scheduled underwriting downturn.
The year-10 case, both ways
The strongest case that year-10 revenue and adjusted FCF are higher
The individual market did not collapse when the enhanced credits expired. CMS data cited by management showed roughly 23 million lives at the 2026 open enrollment, a 5% decline against a record 24 million in 2025 rather than the feared quarter [67], [68], [69], and by April 2026 the interim Wakely data had contraction tracking at or better than the favourable end of management's 20% to 30% range [70]. Oscar grew through it: 3.2 million members at the end of the first quarter of 2026, up 56% year on year, and approximately 3 million paid members at 1 April [71]. Guidance is $18.7 billion to $19.0 billion of revenue and $250 million to $450 million of earnings from operations for 2026 [72].
The structural argument behind it is that employer coverage is migrating toward individual coverage, that ICHRA is the mechanism, and that the largest carrier dedicated exclusively to the individual market is the natural beneficiary. The category is essential, the underlying APTC structure survived the 2025 fight intact even as the enhancement lapsed, and the statutory minimum-MLR floor means no rival can attack Oscar's underwriting margin because there is no excess margin to take. Revenue ten years out on this reading is comfortably above $11.7 billion; adjusted free cash flow follows once the risk-adjustment position normalises and administrative leverage compounds.
The strongest doubt
Ninety-eight per cent of revenue depends on one statute, 93% of premium cash arrives from one payer, and the subsidy that determines whether the product is affordable is voted on by Congress. That variable moved once already, and management's own expectation is that it reduces the market by the lower end of a 20% to 30% range across 2026 [73]. The share position that carried Oscar through it — 17% of footprint to 30% — was handed over by carriers who exited, and every one of them can re-file rates for any plan year, because as the filing puts it, "We elect to participate in a given individual market on an annual basis." Reversion to the 2025 footprint share at current rates puts revenue near $10.6 billion to $10.8 billion, below 2025, without any operating failure at Oscar. Underneath that, adjusted free cash flow has been positive in four of six years, has never held a positive five-year base, and in 2025 was $970.8 million only because $1,029.4 million of money owed to CMS had not yet been paid.
The read
The gate is not met. Year-10 revenue and adjusted free cash flow being higher than today's requires very high conviction, and the record supplies genuine doubt from three independent directions: a single legislated demand driver that has already been cut once, a market position taken by annual election rather than held by structure, and a cash-flow series with no stable base and no five-year history to average. The strongest fact against this read is that Oscar has just grown revenue 61% and membership 56% straight through the exact shock the doubt is built on, which is real evidence that the business is more resilient than the concentration figures alone imply. It does not close the gap, because the growth came from share taken out of a shrinking market rather than from anything that would stop a rival taking it back. What would change the read: three to four consecutive years of positive adjusted free cash flow measured without the risk-adjustment payable build, footprint share holding above 25% through a plan year in which two or more of the withdrawn national carriers re-file, and a permanent statutory subsidy structure that no longer expires on a schedule.
The yield arithmetic (Yield) and the capital-allocation record (Self-Help) are scaled tests; this gate sits ahead of them by the framework's own construction.
What the record establishes
Oscar has never repurchased a share as a public company — Item 5 of the FY2025 10-K answers the question with one word, "None" [1]. The share count has risen every year since listing, and rose 33.1 million shares in the fourth quarter of 2025 alone on convertible-note conversions [2]. The February 2026 credit agreement restricts repurchases outright [3]. Across twelve earnings calls there is no repurchase authorisation, no executed repurchase, and no analyst question on the subject.
The balance sheet against the problem's duration
The face of the balance sheet reads comfortably. At December 31, 2025 Oscar held $2,774.2 million of cash and equivalents, $1,216.5 million of short-term investments and $1,471.0 million of long-term investments — about $5.46 billion — against $430.1 million of carrying-value long-term debt [4]. On a net-debt basis that is roughly $5.0 billion of net cash.
Two liabilities on the same page take most of it back. Benefits payable stood at $1,455.4 million and the risk adjustment transfer payable at $2,587.7 million — $4,043.1 million of claims and federal-program obligations sitting inside the regulated insurance subsidiaries [5]. Management sized the third-quarter 2025 risk adjustment payment for the 2024 policy year at approximately $1.6 billion in a single transfer [6].
Cash + Investments ($M)
Claims + Risk Adj. Payable ($M)
Held at Parent ($M)
Subsidiary Excess Capital ($M)
Sources: FY2025 10-K, Consolidated Balance Sheets [7]; Management Discussion and Analysis, Liquidity and Capital Resources [8]. Total cash and investments is the sum of cash, short-term and long-term investments as reported.
Where the money sits decides what can be done with it. Of the $5.5 billion, $414.2 million was held at the parent and entities outside the Health Insurance Subsidiaries, of which $14.7 million was restricted; the other $5.1 billion sat inside the insurance subsidiaries [9]. Combined statutory capital and surplus was estimated at approximately $1.0 billion, and the subsidiaries' excess over the minimum risk-based capital requirement fell from $734 million at the end of 2024 to approximately $315 million at the end of 2025 [10].
The parent-only statements in Schedule I make the direction of travel explicit. In FY2025 the parent generated $0.3 million of operating cash, put $160.9 million into subsidiaries, and funded itself with $410.0 million of new convertible notes [11]. Across 2023–2025 the parent received $210.0 million in capital distributions and loan repayments from the Health Insurance Subsidiaries and sent $469.6 million back down [12]. Distributions up to the parent fell from $133.0 million in 2024 to $25.0 million in 2025, while contributions down to the subsidiaries ran $146.6 million and $120.8 million [13][14].
The maturity schedule
Source: FY2025 10-K, Note 9 Debt [15][16][17]. The 2027–2030 rows are holder put dates on the same $35.0 million of 2031 Notes, not additive obligations.
The wall is small and late. Total principal outstanding at December 31, 2025 was $445.0 million: $410.0 million of 2030 Notes at 2.25% maturing September 1, 2030, and $35.0 million of 2031 Notes at 7.25% maturing December 31, 2031 [18]. Cash interest paid in FY2025 was $12.8 million [19]. Refinancing risk over the next four years is close to nil: nothing is contractually due before the June 2027 put on $35.0 million, and both instruments convert into stock rather than cash at the company's election — the 2031 Notes at approximately $8.32 [20] and the 2030 Notes at approximately $24.82 [21], both below the July 27, 2026 close of $28.34 (fit_features.capitulation_gauge).
The covenants that bind
The constraint is not the maturity schedule; it is the February 6, 2026 credit agreement. The $475.0 million three-year secured revolver prices at Term SOFR plus 4.50%, expires February 6, 2029, and carries a 0.50% commitment fee on undrawn amounts [22]. Substantially all of the company's assets are pledged as collateral, and the negative covenants restrict Oscar's ability to "pay dividends or make other distributions on equity interests, or redeem, repurchase or retire equity interests" [23].
The financial covenants run in two phases. Through the fourth quarter of 2026: specified levels of direct policy premiums each quarter, a minimum consolidated adjusted EBITDA each quarter, and minimum liquidity plus undrawn commitments of at least $200.0 million, of which at least $100.0 million must be unrestricted cash at the Company and the guarantors. From the first quarter of 2027: maximum total net leverage of 3.50:1.00 and minimum fixed-charge coverage of 3.00:1.00 [24].
That last package sets the practical ceiling on any repurchase. Parent unrestricted cash and investments were $414.2 million less $14.7 million restricted, or $399.5 million; the covenant reserves $100.0 million of it. The envelope before the leverage and coverage tests engage in 2027 is on the order of $300 million — about 3.5% of a market capitalisation of roughly $8.5 billion at 301.1 million shares outstanding and the July 27, 2026 close of $28.34 [25]. A repurchase programme large enough to add ten points to earnings per share would need roughly $850 million a year.
The company can comfortably outlast the problem — the maturity schedule proves that much. What it cannot do is fund repurchases while it is doing so. Management framed the same capital position around growth, not return: on the Q4 2025 call the CFO gave the rule of thumb that "for every $1 billion of premiums, we are required to hold approximately $50 million of capital" [26], against 2026 revenue guidance of $18.7–19.0 billion [27]. On that arithmetic the 2026 book alone absorbs roughly $900 million of statutory capital.
The repurchase record — executed, not authorised
There is nothing to grade. Item 5 of the FY2025 10-K reports issuer purchases of equity securities as "None" [28]. The Consolidated Statements of Cash Flows carry no repurchase line in 2023, 2024 or 2025 [29]. Treasury stock has been frozen at 315 thousand shares across both balance-sheet dates [30]. The only repurchase in the structured record is $3.0 million in FY2019, two years before the IPO (fit_features.share_count_trend.buyback_cash_per_year). No repurchase authorisation appears anywhere in the FY2021–FY2025 10-Ks; the only mention of buybacks in the archive is a FY2022 risk factor explaining how the Inflation Reduction Act's 1% excise tax would apply if the company were ever to repurchase stock [31].
Source: reported weighted-average basic share counts. FY2023–FY2025 tie to the FY2025 Consolidated Statements of Operations [32]; FY2019–FY2022 are fit_features.share_count_trend.per_year. The feature file's FY2024 entry is the diluted count of 265.9 million, so the chart plots the 240.4 million basic figure the 10-K reports. Repurchase cash was zero in every year from 2020 onward.
The feature file records a five-year share-count CAGR of 55.1% and marks the trend rising: true. Some of that is the 2021 IPO recapitalisation, which is not a governance signal. The post-IPO record is the relevant one, and it points the same way: weighted-average basic shares went from 212.5 million in FY2022 to 262.4 million in FY2025, and from 216.9 million in the first quarter of 2023 [33] to 298.2 million in the first quarter of 2026 [34] — 37.5% more shares in three years.
The fourth quarter of 2025 supplied the largest single increment. Holders converted $270.0 million of 2031 Notes into approximately 32.4 million Class A shares, and Oscar issued a further 0.7 million shares as part of a $17.8 million inducement payment to Dragoneer [35][36]. That is 33.1 million shares — 12.6% of the FY2025 average count — issued to retire $270.0 million of debt at an effective $8.32 conversion price, in a quarter when the stock traded in the twenties. The economics of that exchange belong to the noteholders.
Alongside it, cash-flow items connected to equity in FY2025: $34.4 million spent on capped calls that cap dilution from the 2030 Notes at $37.46 per share, $4.4 million of cash inducement, $4.0 million of tax on net share settlement, against $55.0 million received from option exercises [37][38]. Net, share-related activity was a $12.1 million inflow. Stock-based compensation ran $87.7 million through the cash-flow statement in FY2025, $109.8 million in FY2024 and $159.7 million in FY2023, with a further $12.8 million capitalised into software in 2025 [39][40]. Another 13.9 million shares remain available for future issuance across the 2021 and 2022 plans [41].
The framework treats a persistently rising share count driven by stock-based compensation and dilutive issuance as disqualifying rather than as a matter of degree. Oscar's count rises on both, and no repurchase has ever offset either.
What the cash flow will actually support
The deterministic feature file cannot compute adjusted free cash flow, the adjusted yield, or float-retirement years for Oscar: fit_features.not_computable records "no annual free cash flow or operating cash flow plus capex" for adjusted FCF, and float-retirement years fails for want of a positive adjusted FCF figure. The reason is a gap in the structured feed, not in the filings — the FY2025 cash-flow statement reports every component. The figures below are therefore derived here from the filed statement, and are labelled as such rather than substituted for the feature.
Source: derived from the FY2025 10-K Consolidated Statements of Cash Flows [42]. Adjusted FCF = operating cash flow − capital expenditure − stock-based compensation; no acquisition line is disclosed in FY2023–FY2025 investing activities, so the five-year acquisition adjustment is zero as reported. The second series removes the year's movement in the risk adjustment transfer payable, a federal-programme liability that is later paid out in cash.
On the reported basis FY2025 adjusted free cash flow is $1,094.9 million of operating cash flow less $36.4 million of capital expenditure less $87.7 million of stock-based compensation, or $970.8 million [43]. Against the feature file's market capitalisation of $7,436.1 million that is a 13.1% adjusted yield and 7.7 years of float retirement; against the roughly $8,533.8 million implied by the 301.1 million shares actually outstanding on April 10, 2026, 11.4% and 8.8 years [44].
The reported basis flatters the business. Of that $1,094.9 million of operating cash flow, $1,029.4 million was the increase in the risk adjustment transfer payable — the balance grew from $1,558.3 million to $2,587.7 million over the year [45][46]. That is money owed into the federal risk adjustment programme and settled in cash the following year, as the $1.6 billion Q3 2025 transfer for the 2024 policy year demonstrates [47]. Strip that single item and FY2025 adjusted free cash flow is negative $58.5 million, against $339.1 million in FY2024 and $3.1 million in FY2023. Measured against total revenue of $11,701.4 million in FY2025, $9,177.6 million in FY2024 and $5,862.9 million in FY2023, adjusted cash generation on that basis runs −0.5%, 3.7% and 0.1% respectively [48][49]. The yield question in full is the business of Yield; what matters here is that neither basis produces cash the parent can reach.
The absurdity check
fit_features.float_retirement_years is not_computable, for the reason quoted above. Stated as arithmetic from the filed statement instead: $8,533.8 million of market value divided by $970.8 million of reported adjusted free cash flow is 8.8 years; divided by the $58.5 million negative figure that remains once the risk adjustment payable build is removed, the calculation has no positive solution. The framework's reference point for a price that cannot survive is roughly three years.
The levered exception
It does not apply, and two of its three legs fail independently. Oscar's adjusted yield is 11.4% on the flattering basis, not the ~25% the exception requires. fit_features.balance_sheet_class is unknown — the deterministic pass could not resolve it — but the filed figures show net cash, not leverage. And the exception's second leg, a demonstrated multi-year reduction in share count, fails outright: the count has risen in every year on record.
Management's intent, from the record
Across the twelve earnings calls in the corpus — Q2 2023 through Q1 2026 — the words "repurchase" and "buyback" do not appear once, in prepared remarks or in the question-and-answer sessions. No analyst has asked, and there is no statement of repurchase intent in the record to weigh.
What the calls do contain is a consistent framing of the same capital as growth funding and loss absorption. In November 2024, reporting $575 million of excess capital as of September 30, the CFO said Oscar "continue[s] to believe our excess capital positions us well to fund future growth and allow us additional opportunities to optimize our capital position over time" [50]. That is the closest the archive comes to a capital-return hint, and it was not developed on any subsequent call.
When Josh Raskin of Nephron Research pressed on uses of cash in August 2025 — the only direct analyst question on the subject in the set — the answer was entirely about absorbing losses: "We think that the bulk of the remaining losses that we're forecasting for this year are going to be absorbed by that excess capital position… I do think that parent cash will decline in the back half of the year, largely due to us making some additional capital contribution to the insurance subsidiaries" [51]. Excess capital had fallen roughly $300 million in that quarter alone.
By the Q4 2025 call the framing had moved to raising capital rather than returning it: "we have taken opportunistic steps to strengthen our capital position and optimize our capital structure… during the third quarter, we increased our capital in preparation for 2026 growth, completing a $410 million convertible notes offering due 2030, generating $360 million of net proceeds" [52]. Parent cash and investments then fell from $414 million at December 31, 2025 to $279 million at March 31, 2026, even as subsidiary excess capital recovered to $809 million on a strong first quarter [53].
Insider buying alongside
One purchase, and it came from the company rather than the market. On April 3, 2026 — four days after the $10.85 trough — Oscar entered a stock purchase agreement with Mark Bertolini and sold him 1,000,000 Class A shares at $11.92, the prior trading day's close, for $11.9 million, in a private placement under Section 4(a)(2) [54]. The Form 4 record carries it as a purchase settled on April 6 [55]. It is the chief executive putting personal cash in near the low, and it is the only insider buying in the file since August and September 2021, when Joshua Kushner and the Thrive vehicles bought approximately 5.0 million Class A shares for roughly $79 million in the $12.69–$18.35 range and Mario Schlosser bought 57,300 shares at $17.53 [56]. The Form 4 feed codes the April transaction P, its open-market purchase code; the 10-Q's description of a stock purchase agreement with the company is the more exact one. Nothing else was bought on either side of the March 30, 2026 close of $10.85 (fit_features.capitulation_gauge).
Selling in the opposite direction is on the record. Between June 25 and June 30, 2026, Bertolini disposed of 2,445,306 shares at $28.35–$30.08 for approximately $70.7 million, and Schlosser sold approximately $30 million across June and July 2026 [57]. That left Bertolini's reported holding at 7,751,570 shares [58]. The fair counter-fact: every one of those dispositions is flagged as executed under a Rule 10b5-1 plan, and on November 10, 2025 Bertolini entered the company's standard sell-to-cover instruction, which provides for sales of as many shares as are needed to cover tax withholding on the vesting or settlement of his restricted stock units [59]. Those are settlements, not a view. What stands without qualification is the company's own side of the ledger: through a decline to $10.85 and a recovery to $28.34 it repurchased nothing, and the 1,000,000 shares it moved at the low it sold rather than bought.
Dividend safety
Immaterial to the case. Oscar "has never declared or paid any cash dividends" and does not anticipate paying any in the foreseeable future; state insurance holding company law and the 2026 credit agreement both restrict distributions [60][61].
Management credibility
The sample below is the five most material forward commitments in the transcript archive from two to four years back, each checked against what the company subsequently reported.
Sources: Q2 2023 call [62]; Q2 2024 call [63]; Q3 2024 call [64]; Q4 2024 call [65]; Q2 2025 call [66]; FY2025 results as reported [67].
The 2023 and 2024 commitments were met on the company's own subsequent reporting: full-year 2024 adjusted EBITDA of $199 million and net income of $25 million, both stated on the Q4 2024 call [68].
Revenue and membership guidance has been reliable; margin guidance has not. The FY2025 miss is the largest instance — an operating profit of $225–275 million guided in February 2025 became a $396.4 million operating loss, an 87.4% medical loss ratio against 80.7–81.7% guided [69]. Management attributed the gap to market morbidity and the resulting risk adjustment accrual, which is the genuinely hard estimate in this business and is the subject of Damage Math.
The instance that bears on character rather than forecasting is the long-term target. At the June 2024 Investor Day the company committed to "at least 20% revenue CAGR and a 5% operating margin by 2027" [70]. It was carried in prepared remarks on the three calls that followed, through February 4, 2025 [71], then appeared only under questioning, as late as August 6, 2025, when Bertolini said "we're not changing our longer-term forecast at this moment, but 5% is still our target" [72]. It has not been stated on any call since: not the November 2025 call, where it goes unmentioned, and not the Q4 2025 call of February 10, 2026 or the Q1 2026 call of May 6, 2026, neither of which restates it, withdraws it, or explains its absence; management now points to a September 16 investor day [73]. The +Oscar/Campaign Builder platform business, one of four named strategic pillars through 2023, disappeared from prepared remarks after Q2 2024 on the same pattern.
Set against that, the ownership test cuts the other way. Bertolini beneficially owned 11,925,092 Class A shares at April 10, 2026 — 8,599,999 held directly, 391,760 in near-term exercisable options, and 2,933,333 through the Anahata Foundation of which he is co-trustee [74][75]. His FY2025 pay was $1,149,308 in total, of which $619,178 was salary and nil was stock or option awards [76]; the CEO pay ratio was 10.4:1 [77]. Executives and directors as a group hold 21.8% of Class A on an as-converted basis and 77.2% of the voting power [78]. Even after the June 2026 settlements, the chief executive's directly held stake is worth roughly $220 million at $28.34 — many multiples of his cash compensation.
The read the evidence supports: this is not the promotional-CEO pattern the framework excludes. That pattern requires big claims, repeated misses and an absent economic stake, and the third leg is plainly missing here. What the record does contain is one substantiated instance of a multi-year target carried for six calls and then dropped without acknowledgement, in a company that has also quietly retired a named strategic pillar. The strongest fact against a benign reading is that the September 2026 investor day, not a call, is where the 2027 numbers were sent — a target restated or formally withdrawn there would settle it, and a third consecutive call without mention would not.
What would change this read
A board authorisation of a repurchase programme with cash actually deployed, disclosed in Item 5 rather than announced; a covenant amendment or refinancing that lifts the restricted-payments limitation; sustained parent-level free cash flow independent of the risk adjustment payable cycle; or an inflection in the share count from conversions and stock-based compensation into net retirement. None of these is present in the record through the first quarter of 2026. The timing of any of them is the business of Clock; the durability of the underlying cash generation, of Durability.
What has to happen, and when
The re-rating mechanism at Oscar Health is the ACA individual-market repricing cycle, and the record shows it has already fired: a roughly 28% weighted average rate increase for plan year 2026 filed across states covering close to 99% of membership [1], a first-quarter 2026 print of $2.07 per diluted share against $1.10 consensus [2], and a share price 161% above its 30 March 2026 trough. Long-dated listed options run to January 2028 at implied volatility near 78%.
The repricing mechanism
Oscar's economics reset on an annual clock by construction. The company elects to participate in each individual market on an annual basis, and its premium rates and specific rate changes require approval from state and federal regulators under the ACA [3]. That is the mechanism the framework's healthcare-forecasting-error pattern looks for: a cost miss in one plan year is repriced into the next year's premiums, industry-wide, on a calendar the regulator enforces.
The 2025 miss and the 2026 repricing are both on the record. Market morbidity stepped up across the industry as Medicaid redetermination lives entered the exchanges; Oscar's FY2025 loss from operations was $396 million [4]. Management refiled 2026 rates in states covering close to 99% of membership at a roughly 28% weighted average increase, explicitly reflecting elevated trend, higher 2025 market morbidity, the expiration of the enhanced premium tax credits, and CMS program-integrity initiatives [5]. Guidance introduced on 10 February 2026 put FY2026 revenue at $18.7 billion to $19 billion, up 61% year over year at the midpoint [6], and a swing of nearly $750 million in earnings from operations at the midpoint [7].
The second mechanism was a feared event whose consequence did not arrive at the size the market priced. The enhanced premium tax credits did expire at the end of 2025 [8], and Oscar had priced 2026 assuming exactly that [9]. What followed was membership of 3.2 million at 31 March 2026, up 56% year over year, and approximately 3 million paid members at 1 April with payment rates consistent year over year and modestly favorable to plan despite the subsidy sunset [10]. Against a company estimate of 20% to 30% market contraction [11], the first Wakely read tracked in line to favorable [12].
Both mechanisms are visible in one quarter's arithmetic. First-quarter 2026 revenue rose 53% to $4.6 billion, the medical loss ratio improved 490 basis points to 70.5% with utilization largely in line with expectations, and earnings from operations reached $704 million [13]. Net income was approximately $679 million, or $2.07 per diluted share, the highest in the company's history, and full-year guidance was reaffirmed [14].
The third mechanism the framework looks for — a shrinking share count — is absent here. Oscar's share count has risen every year on the record, with a five-year compound growth rate of 55.1%, and the feature file records the trend as rising; the detail sits in Self-Help.
What is still on the calendar
Sources: Q2 2026 call date, company announcement of 13 July 2026 [15]; Investor Day date and the 2027 pricing-cycle exchange, Q1 FY2026 transcript [16] [17]; Q2 as the first claims-based morbidity read [18] [19]; OEP window, litigation and OBBBA, FY2025 Form 10-K [20]; annual rate approval [21]; CMS June settlement cycle [22].
The nearest of these is nine days out. Management framed the second quarter as the first quarter in which claims data, rather than demographic proxies, shows what 2026 market morbidity actually is [23], and named the Wakely report and risk adjustment as the variables that could still move the 2026 outlook [24]. The risk-adjustment accrual was booked at 24.5% of premium in the first quarter [25] against a full-year expectation of approximately 20% [26], with none of the observed market morbidity favorability recognised [27] — so the mechanism has an identified, dated release valve rather than a hoped-for one.
Base rates from OSCR's own history
The price record runs from the 3 March 2021 listing to 27 July 2026 — 1,357 trading days. Segmenting it by 35% swing reversals produces thirteen distinct drawdown episodes, which is roughly one every five months.
Source: derived from the run's daily closing-price series, 3 March 2021 to 27 July 2026; episodes segmented at a 35% swing-reversal threshold on closing prices, company filings as reported.
The arithmetic a skeptic can recompute: median depth −42.1%, median 70 calendar days from peak to trough, and — across the twelve episodes that regained their prior peak — a median 170 days from trough back to that peak and 256 days for the full round trip. The tail is wide. Four episodes ran 50% or deeper, all of them in the 2021–22 de-rating, and their trough-to-prior-peak recoveries were 166, 574, 830 and 1,772 days, a median of 702 days. The shortest recovery in the whole set was five days.
Source: derived from the run's daily closing-price series, 3 March 2021 to 27 July 2026; month-end close against the running maximum close since listing, company filings as reported.
Two facts sit inside that shape. The stock has spent its entire listed life below its 10 March 2021 close of $36.77, and at $28.34 on 27 July 2026 it is still 22.9% below it — so at the whole-history level a gap remains. But measured against the episode the fit-feature file defines as the current drawdown — the 19 September 2024 peak of $23.27 to the 30 March 2026 trough of $10.85, a depth of 53.4% over 557 days, on a volume spike of 15.5x the pre-peak median — that gap is closed. The $23.27 peak was regained on 12 May 2026, 43 days after the trough and six days after the Q1 print, and the price is now 21.8% above it. A swing-based segmentation of the same series splits the feature file's single 557-day episode into three separate legs, the last of which fell 40.3% and retraced in 31 days; the two readings differ in bookkeeping, not in direction.
The current episode therefore has no precedent in this name's history in one specific respect: no prior drawdown of 50% or more retraced in anything close to 43 days. The four that did so took between 166 and 1,772 days.
The 18-month read
Re-recognition within 18 to 24 months is not the open question here, because the record shows it has already happened inside four months. From the 30 March 2026 trough at $10.85, the price reached $32.18 on 2 July 2026 — a 197% move in 94 days — and stands at $28.34, up 161% from the trough and 11.9% below that July high. The mechanism fired on schedule (2026 rates repriced ~28%, subsidy sunset absorbed, first quarter printed at a record), and the price moved with it. What remains is not a closing gap but a forward underwriting question about the 2027 cycle: whether pricing holds when the OEP window shortens to six weeks [28] and the stayed program-integrity provisions potentially return.
The strongest fact against that read is that the 2026 result is not yet proven. Full-year guidance implies earnings from operations of $250 million to $450 million against $704 million already booked in the first quarter, and consensus expects a fourth-quarter 2026 loss of $1.23 per share — the year's profit is a first-quarter phenomenon that the back half is expected to spend down. If the June Wakely claims data breaks against pricing, the mechanism unwinds inside the same year it fired. That is the falsifier this tab contributes: 2027 weighted average rate increases failing to cover realised 2026 morbidity, visible first in the 6 August 2026 and November 2026 prints and settled by the CMS final risk-score report in June 2027.
Street positioning and the printed quarter
Close, 27 Jul 2026
Consensus target, mean
Consensus target, median
Consensus recommendation (1=buy, 5=sell)
Source: consensus estimates and target-price data as of 27 July 2026 (10 contributing targets; high $35, low $13), and the run's closing-price series.
The sell side has not capitulated in either direction, and it is behind the price. Eleven in-consensus recommendations split 3 outperform, 7 hold, 1 underperform, with no buy and no sell ratings — a 2.82 score that sits between outperform and hold. The mean target of $24.20 is 14.6% below the 27 July close and the median of $21.00 is 25.9% below it; the $35 high target is 23.5% above. A stock trading above the mean of the targets set on it is not a stock the sell side is waiting to discover.
What the sell side has done is revise. The estimate vintages tell that story more usefully than the ratings do.
Source: consensus normalized EPS estimate momentum, vintages dated 28 January, 28 April, 27 June and 27 July 2026.
FY2027 consensus normalized EPS has moved from $1.00 to $1.52 over six months, and FY2028 from $1.08 to $2.21 — a doubling. Consensus FY2027 revenue over the same window moved from $14.1 billion to $19.8 billion. The revisions are the re-recognition, and most of them landed between the January and April vintages, which brackets the March trough.
Source: reported quarterly EPS and consensus normalized EPS estimates; 2Q26 onward are consensus only, as of 27 July 2026.
Consensus itself puts the recovery in printed numbers in the quarter that has already printed. FY2026 normalized EPS consensus of $1.10 is the company's first profitable year, and 1Q26 alone delivered $2.07 of it. The remaining candidate quarters are 2Q26 on 6 August 2026 [29], where consensus wants $0.39 and the first claims-based morbidity read arrives, and 1Q27, where consensus wants $2.10 and where a second consecutive first-quarter record would establish the 2026 result as a cycle rather than a single reset year. On the 27 July close, consensus normalized EPS puts the shares at 25.8 times FY2026, 18.7 times FY2027 and 12.8 times FY2028 — the multiple already discounts two more years of the revision path holding.
Instrument facts
Listed options on OSCR exist across sixteen expiries, with the two longest dated 17 December 2027 and 21 January 2028 — 508 and 543 days beyond the 27 July 2026 quote, or 16.7 and 17.8 months. Both clear the framework's 12-month reference; the longest sits just short of 18 months.
Source: Cboe delayed option quotes for OSCR, timestamped 27 July 2026 21:49 UTC; expiries with under 1,000 contracts of open interest omitted from the table but included in the totals below. Implied volatility is open-interest-weighted across the listed strikes in each expiry.
Total open interest across the chain is 477,367 contracts, of which 130,498 — 27.3% — sits in the two expiries beyond twelve months. Concentration is high: the January 2027 and January 2028 expiries together hold 60.0% of all open interest. Trading in the long tenors on the quote date was thin: 47 contracts changed hands in the January 2028 expiry and 144 in December 2027, against 7,908 across the whole chain, roughly 88% of which was in expiries inside 60 days. Open interest in long-dated contracts exists; daily turnover in them does not.
Implied volatility is elevated against the framework's reference lines. Cboe published a 30-day implied volatility of 86.6% for OSCR on 27 July 2026. AlphaQuery's independently computed mean implied volatility for the same date reads 88.6% at 30 days and 77.4% at 180 days, against 30-day realised close-to-close volatility of 57.4%. Open-interest-weighted implied volatility in the December 2027 expiry is 77.8% and in January 2028 is 78.0%. The framework's own reference lines treat up to roughly 50–55 as acceptable and 60–70 as elevated; every tenor on this chain sits above 70, and the front end sits above 100.
Those are the instrument facts as of 27 July 2026, stated as facts. Long-dated contracts exist, so the framework's no-qualifying-LEAPS watchlist route does not apply; the implied-volatility level is what it is, and reads across to the damage arithmetic in Damage Math and the drawdown anatomy in Dislocation rather than to anything about expression.