Oscar Health, Inc.'s management explains the business in its own materials. The slides below do the most of that work, pulled from the documents preserved in Sources. Each source link opens the complete presentation at that slide in a new tab.
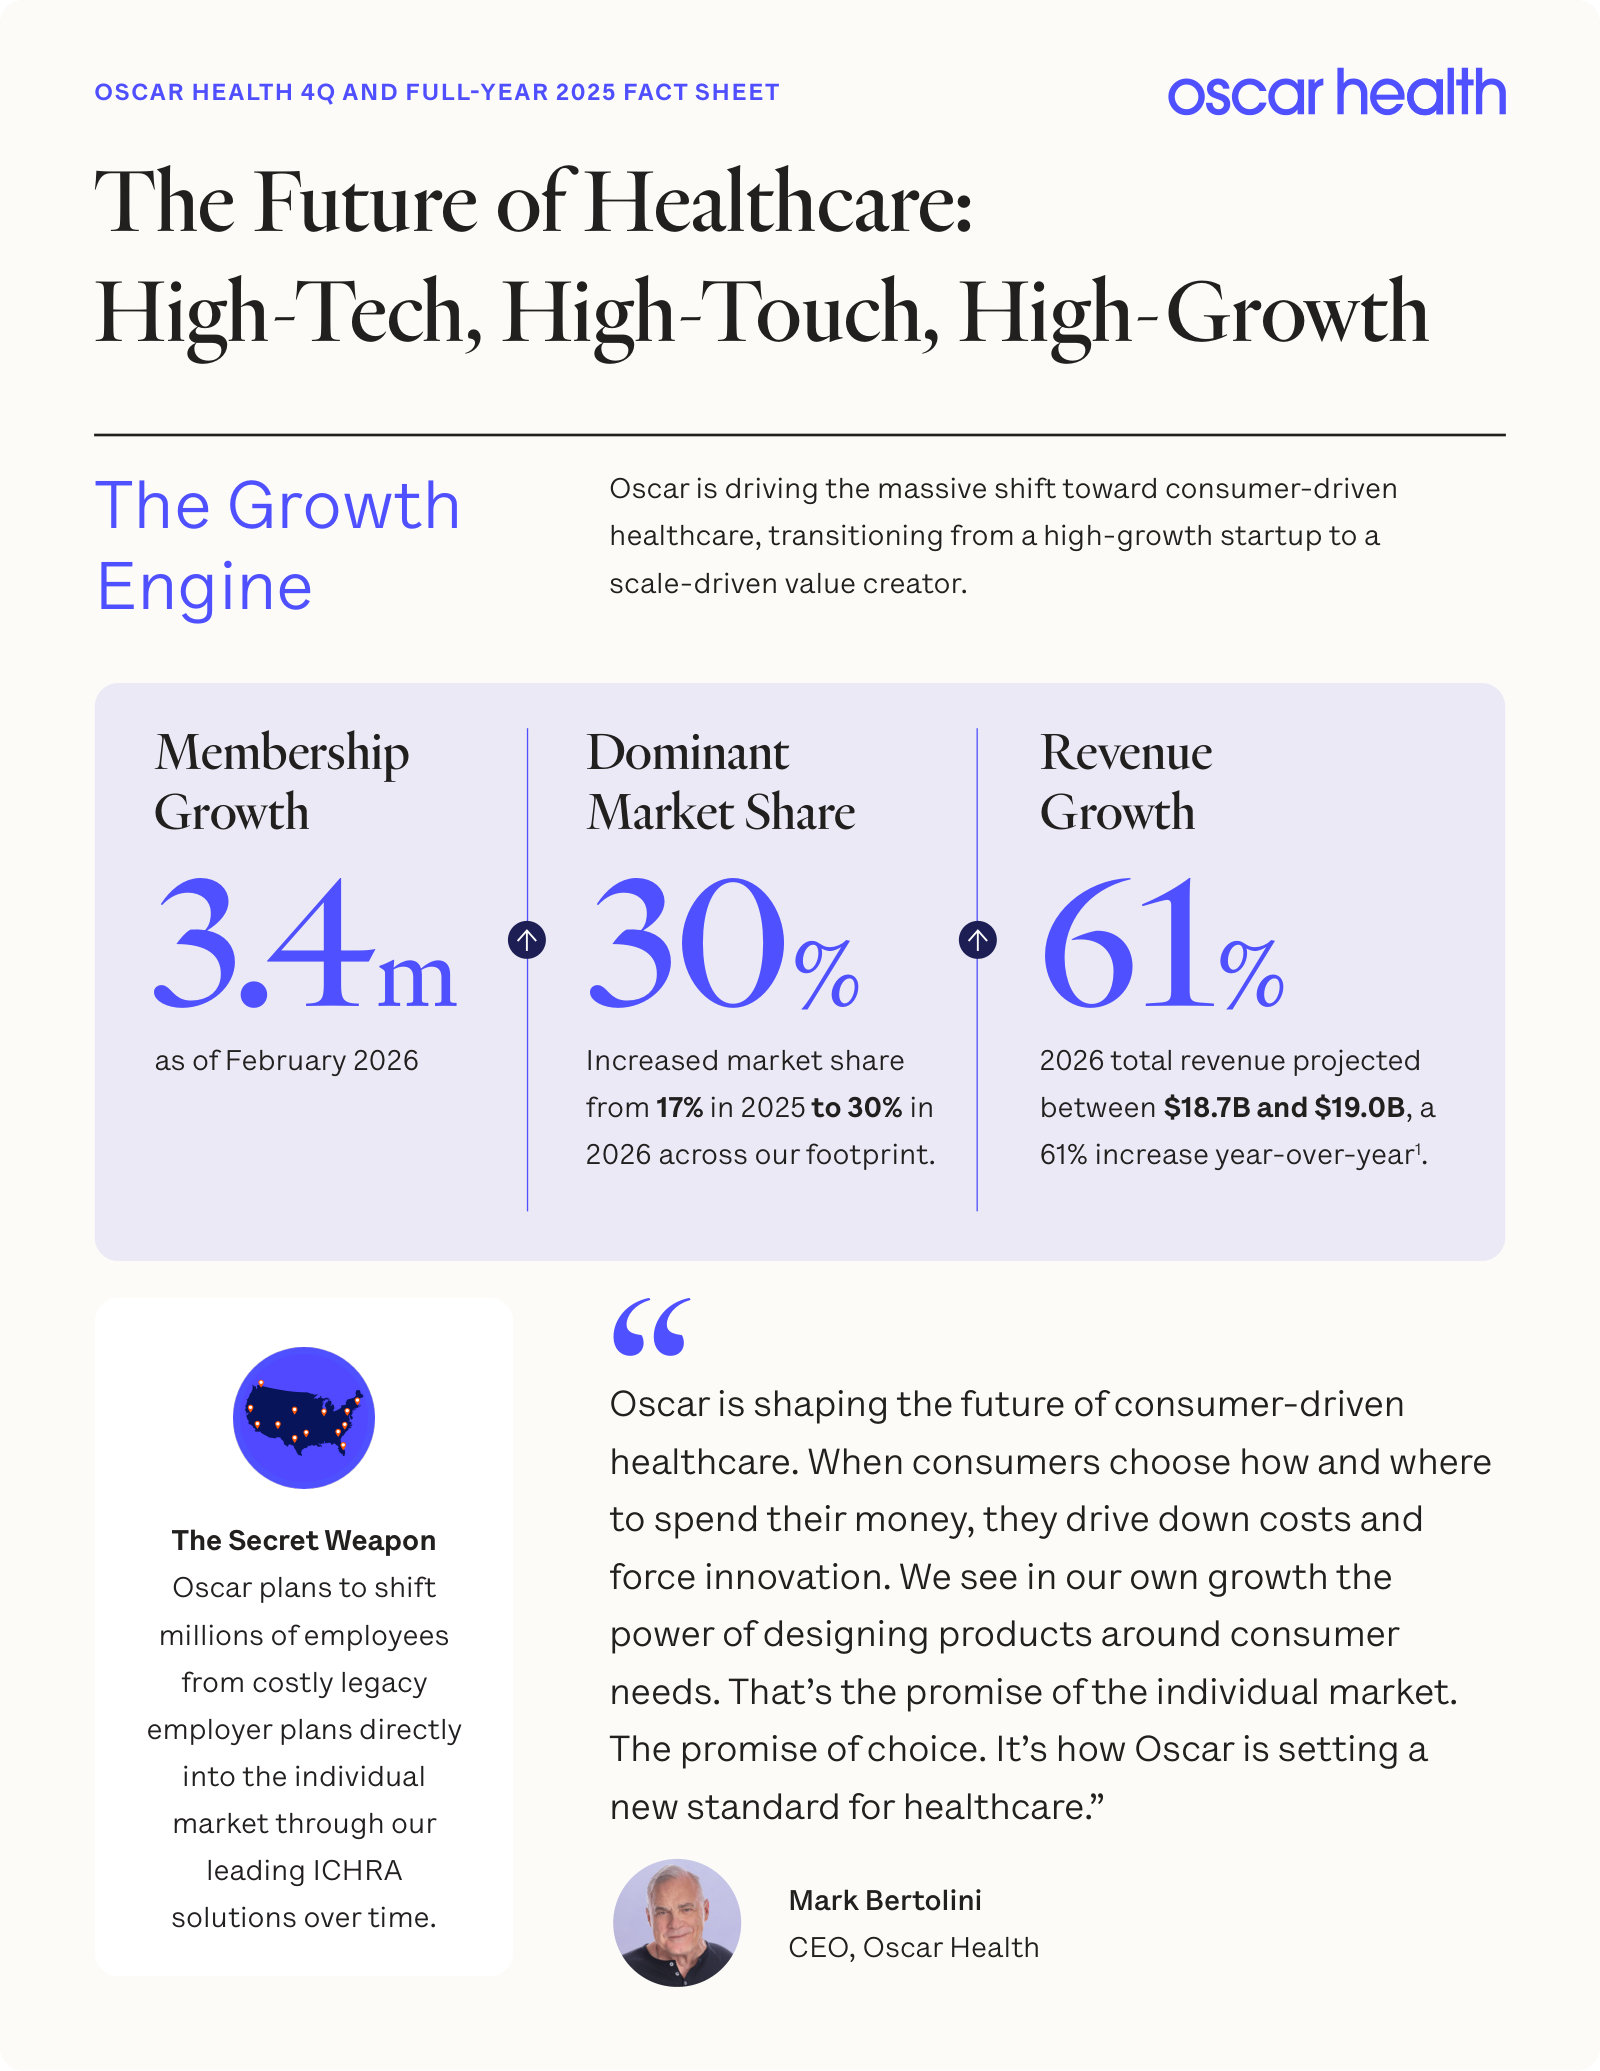
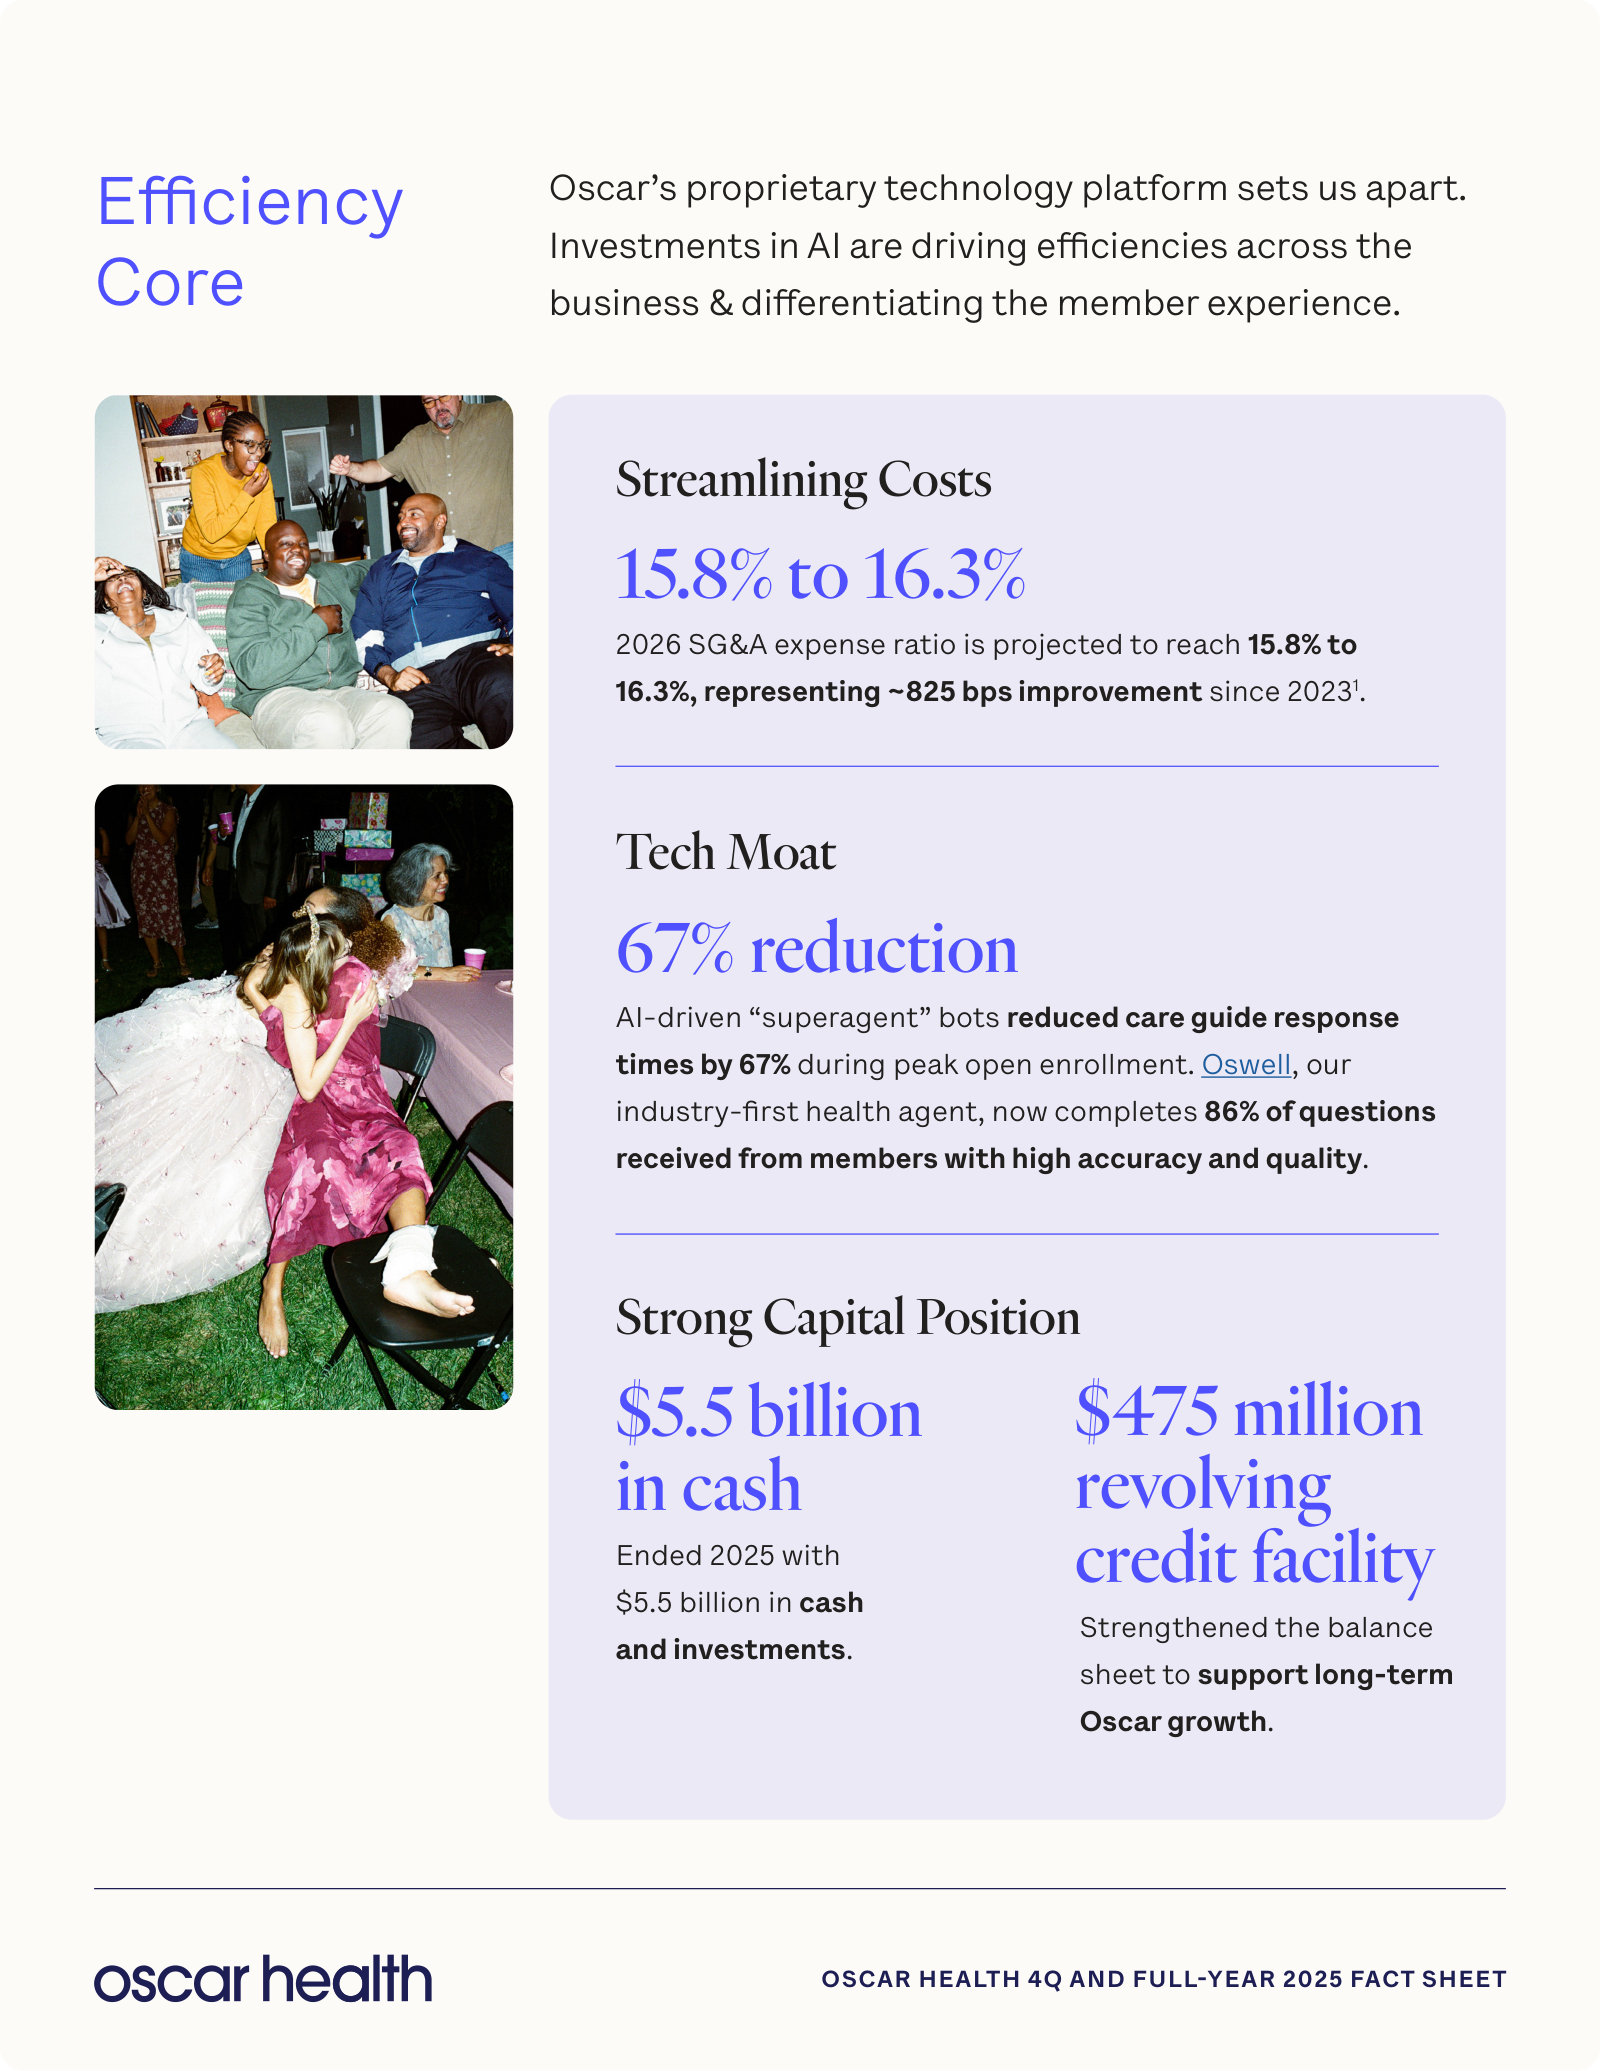
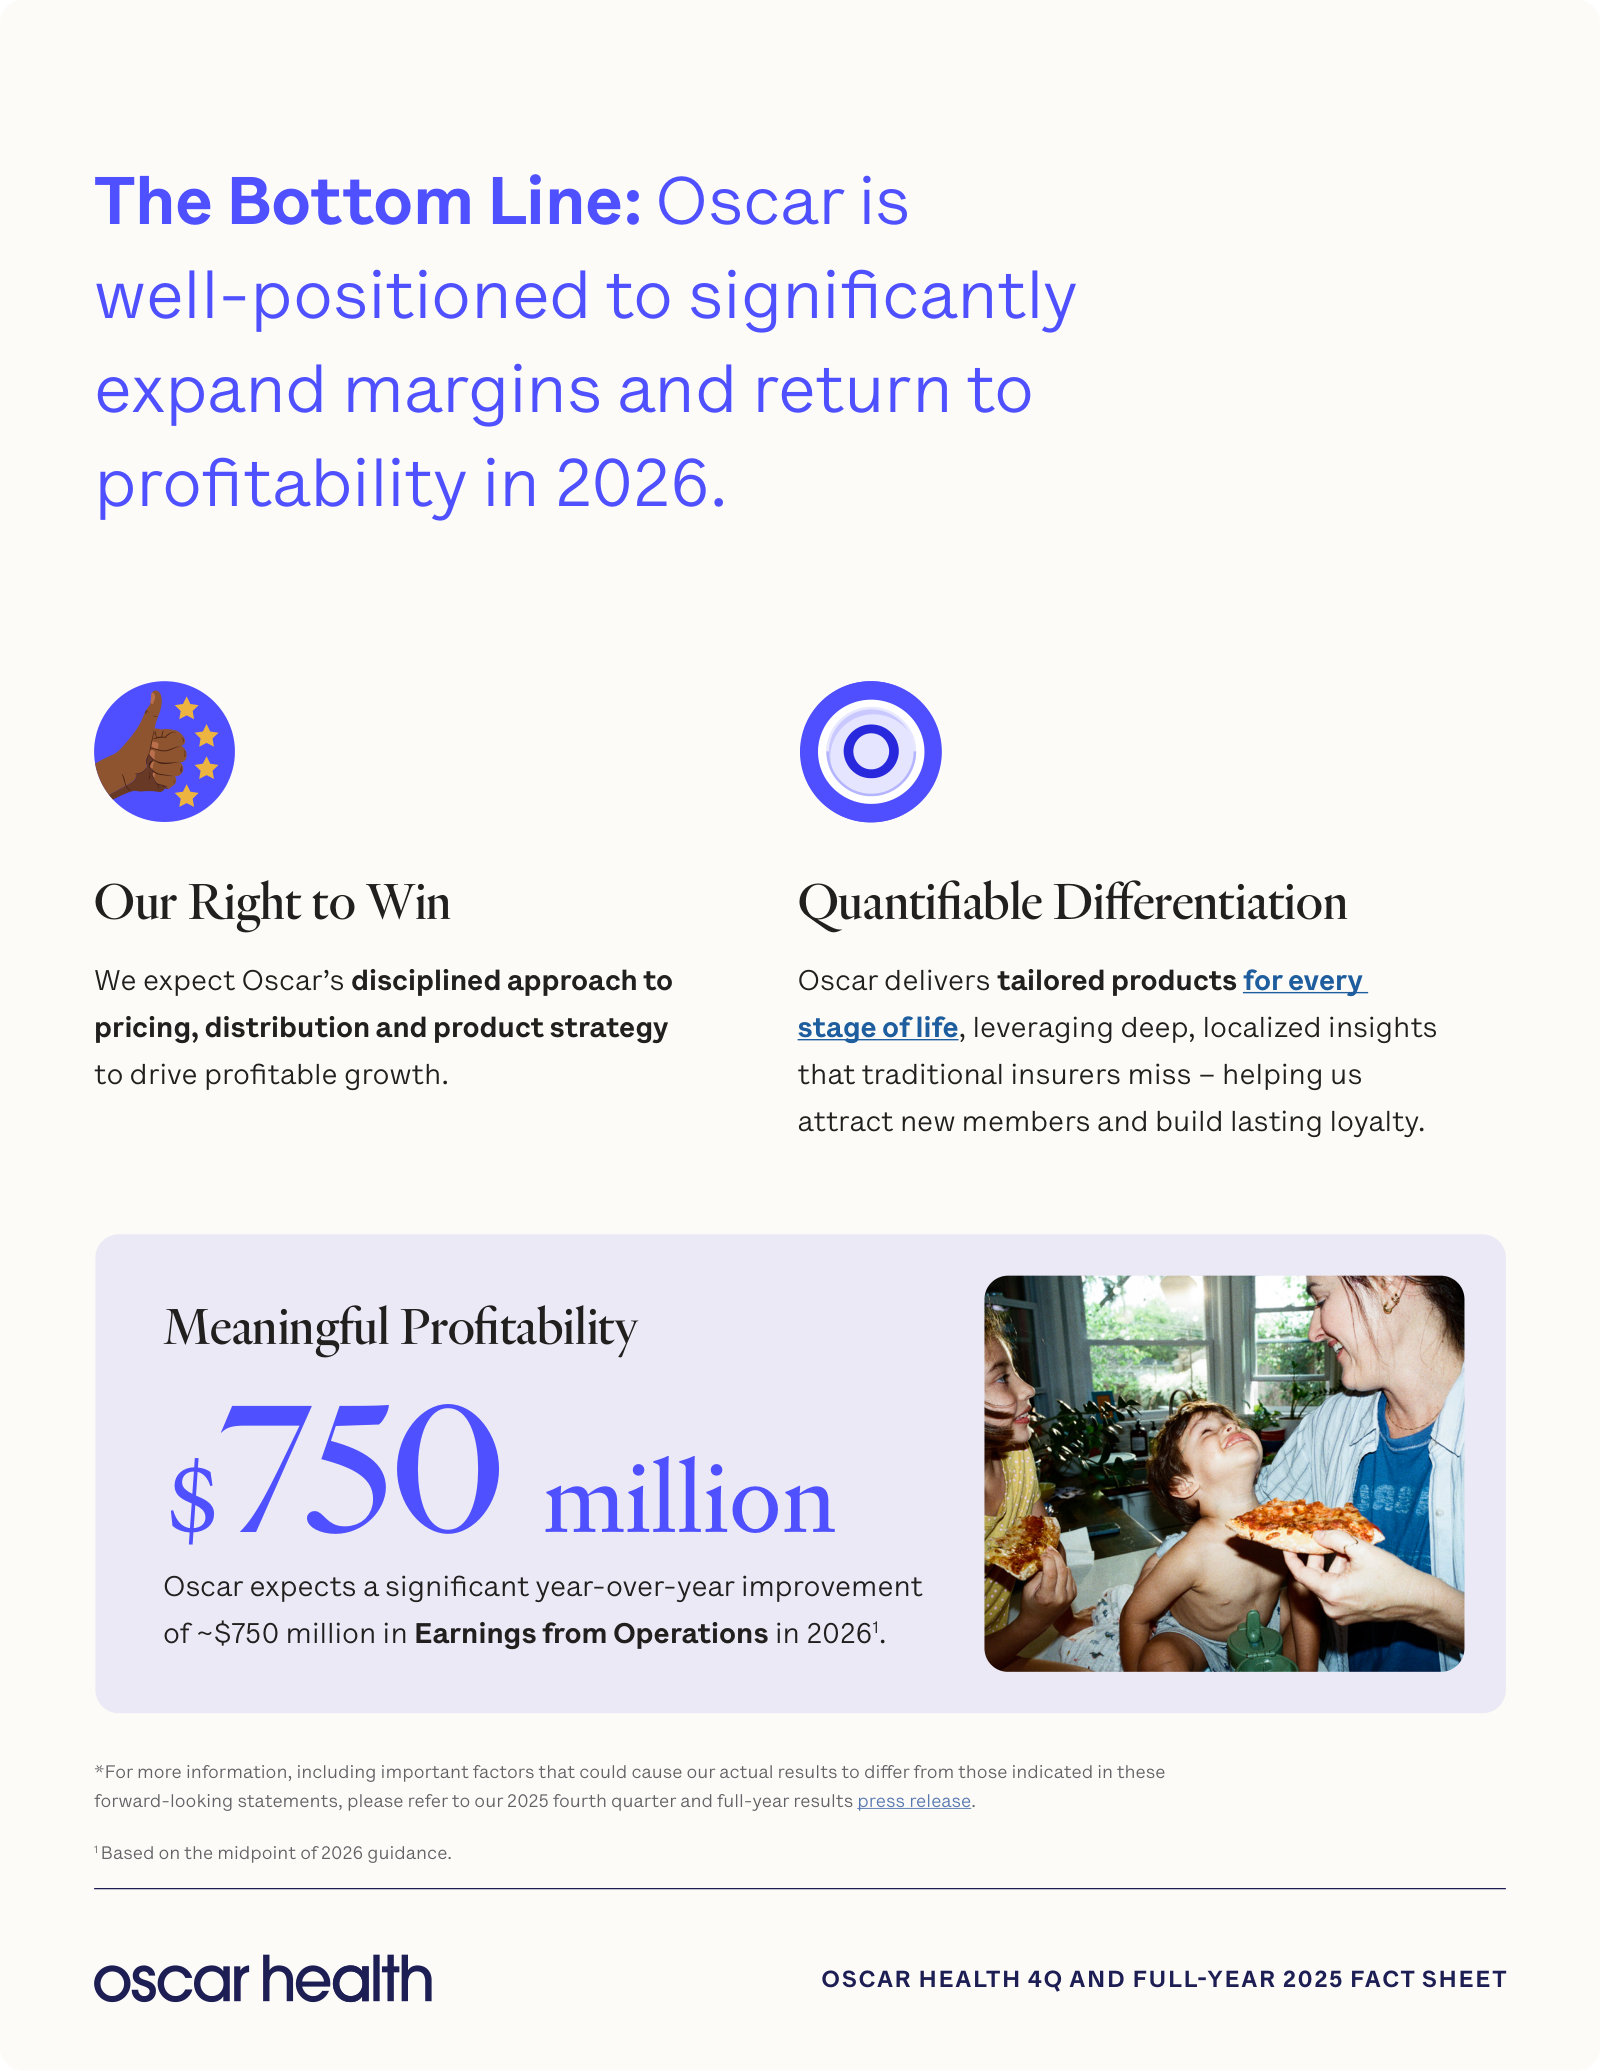
A three-page fact sheet issued with 4Q25 results — current scale, 2026 guidance and the margin story in management's own framing. · Open the full document →
p. 1 — Current scale in three numbers: 3.4M members, 30% share across its footprint, and $18.7-19.0B of 2026 revenue guidance. · Open the full presentation →p. 2 — Where the cost story sits now — SG&A guided to ~16%, AI handling member service, and $5.5B of cash at year-end 2025. · Open the full presentation →p. 3 — The 2026 case in management's words: a ~$750M year-over-year improvement in earnings from operations. · Open the full presentation →
Oscar's most complete public explanation of itself: strategy, market structure, unit economics and the 2027 targets management set. · Open the full document →
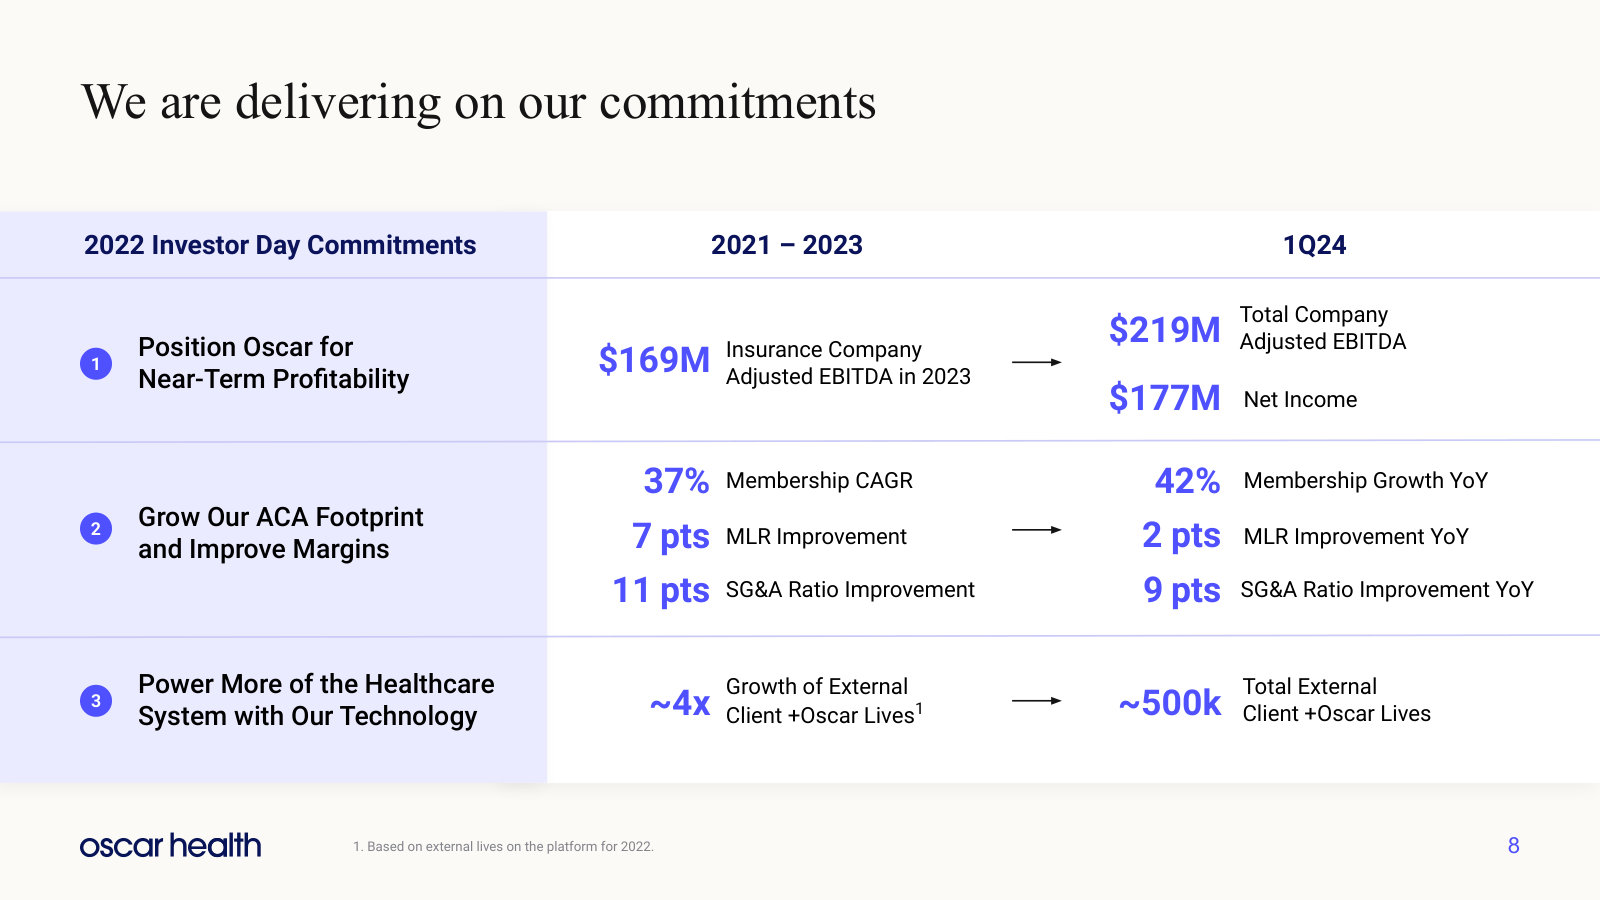
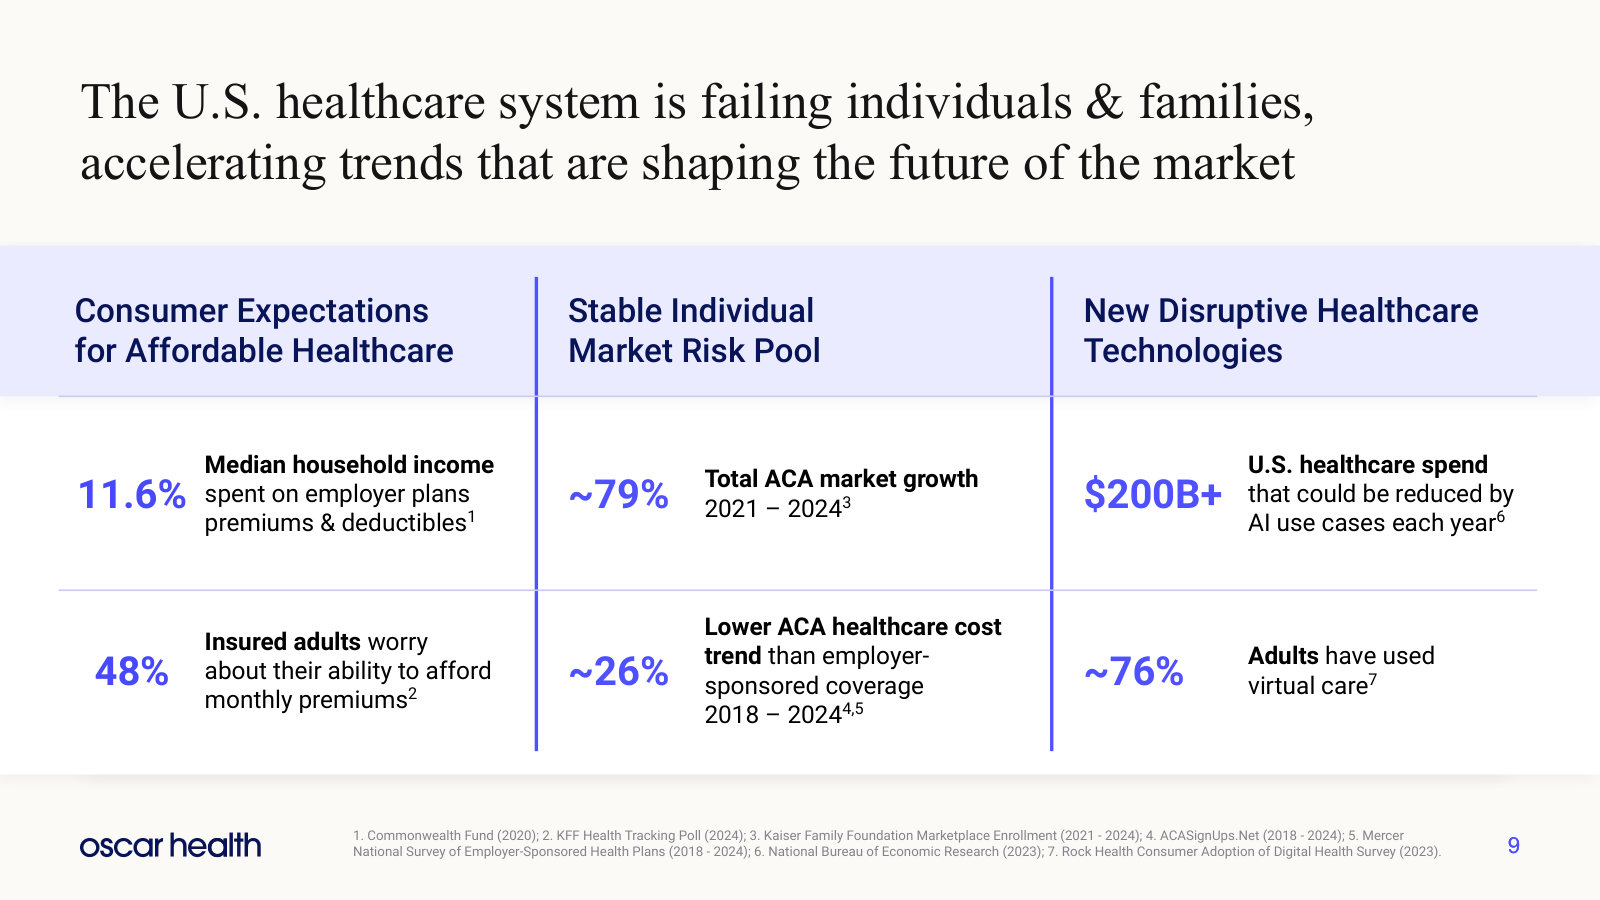
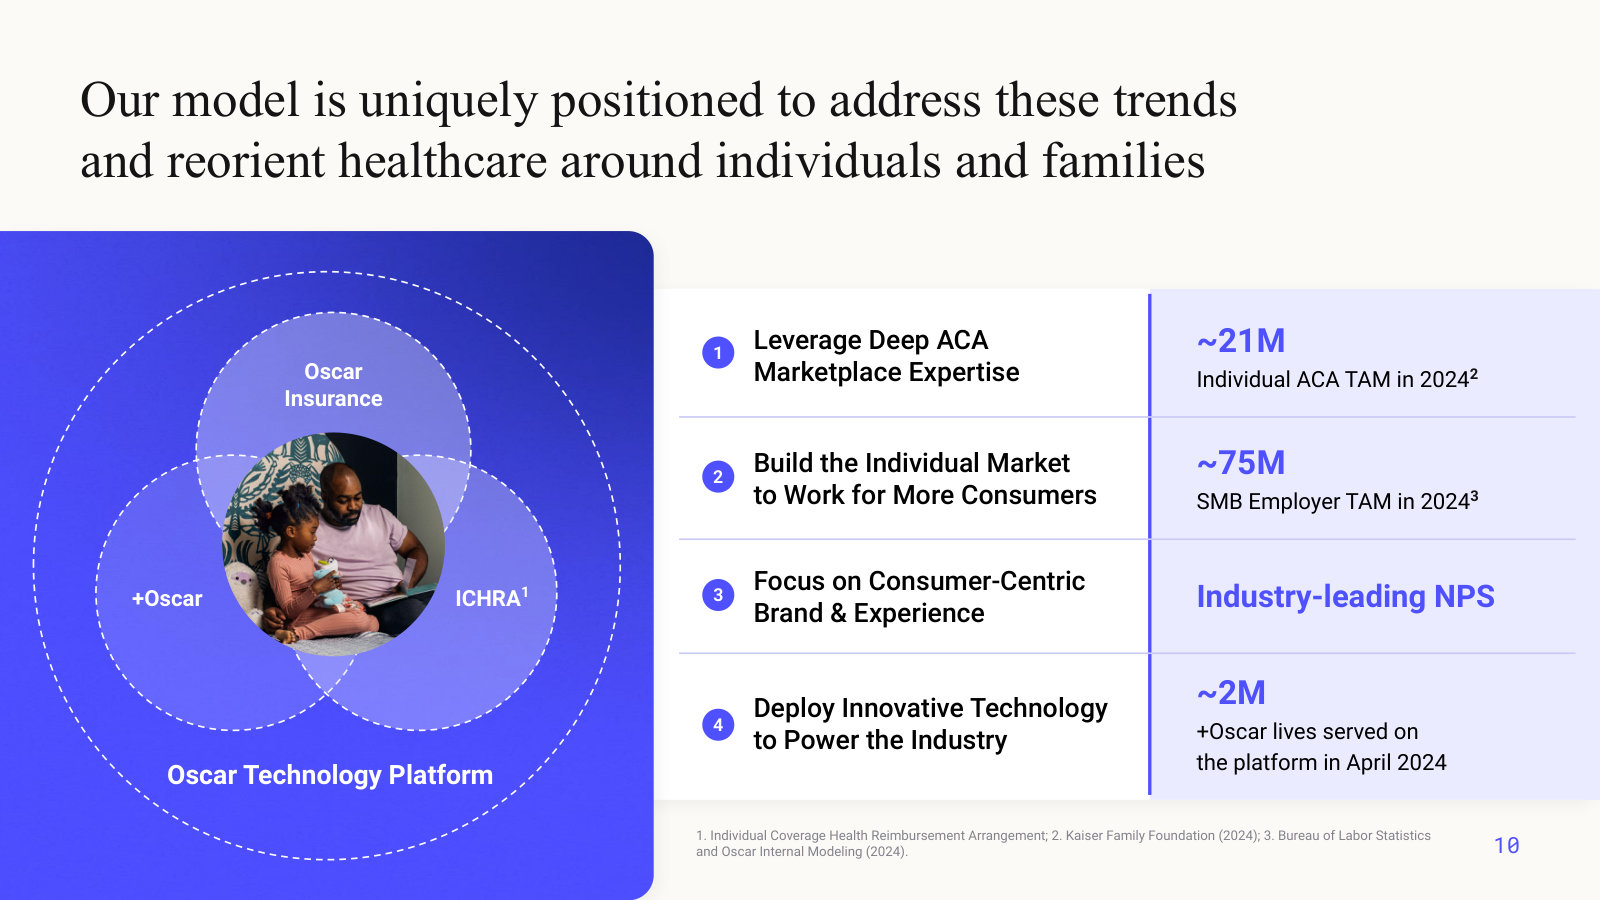
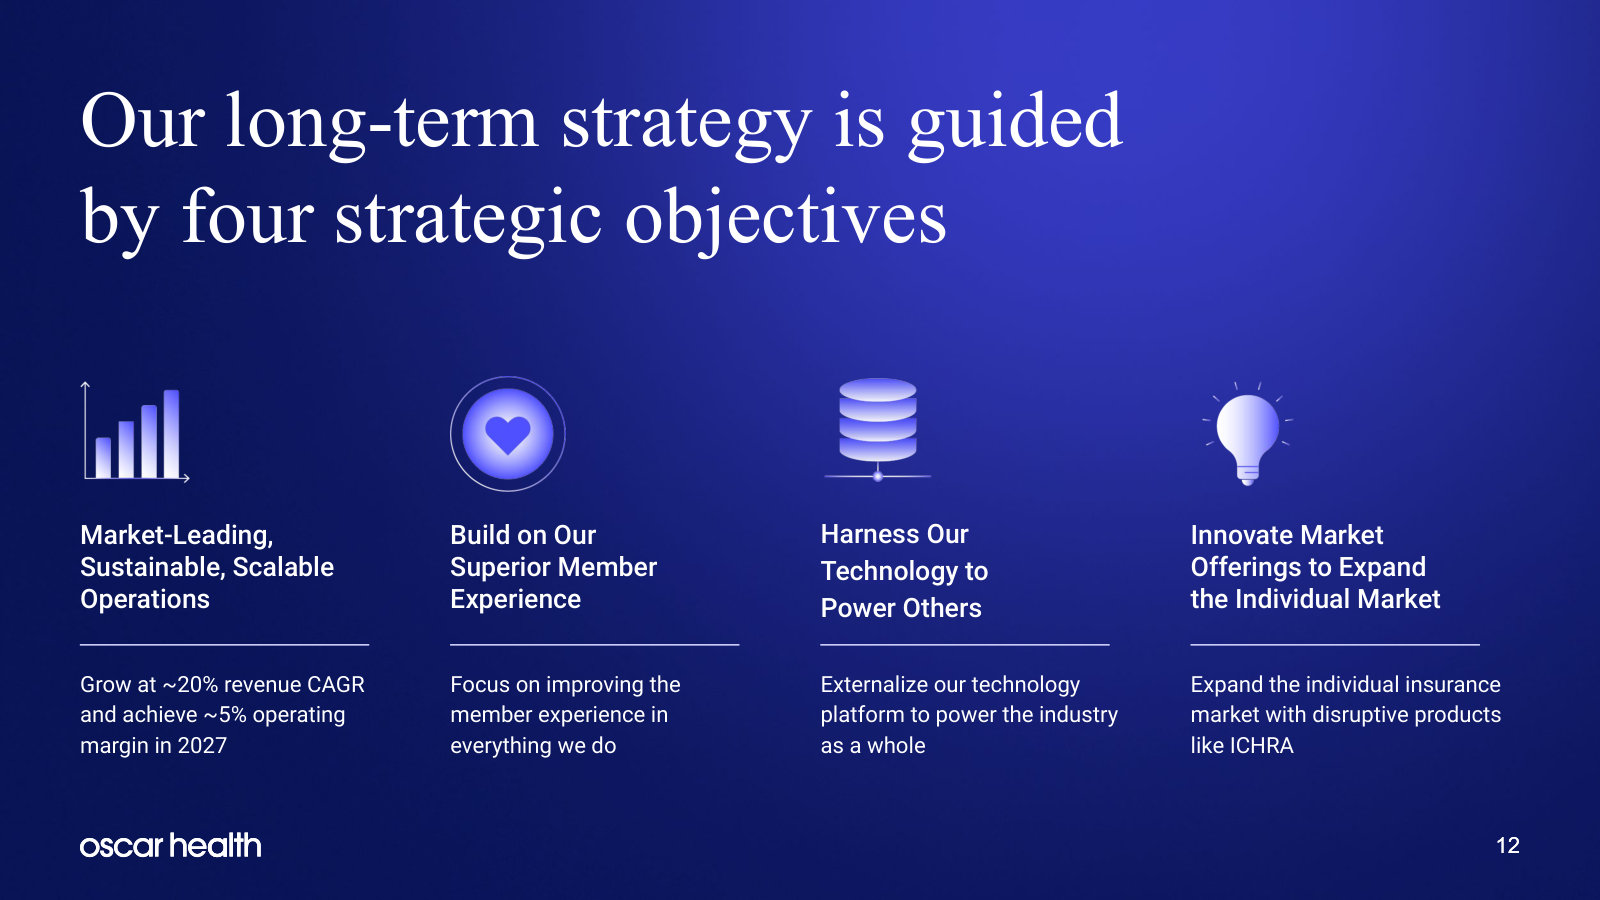
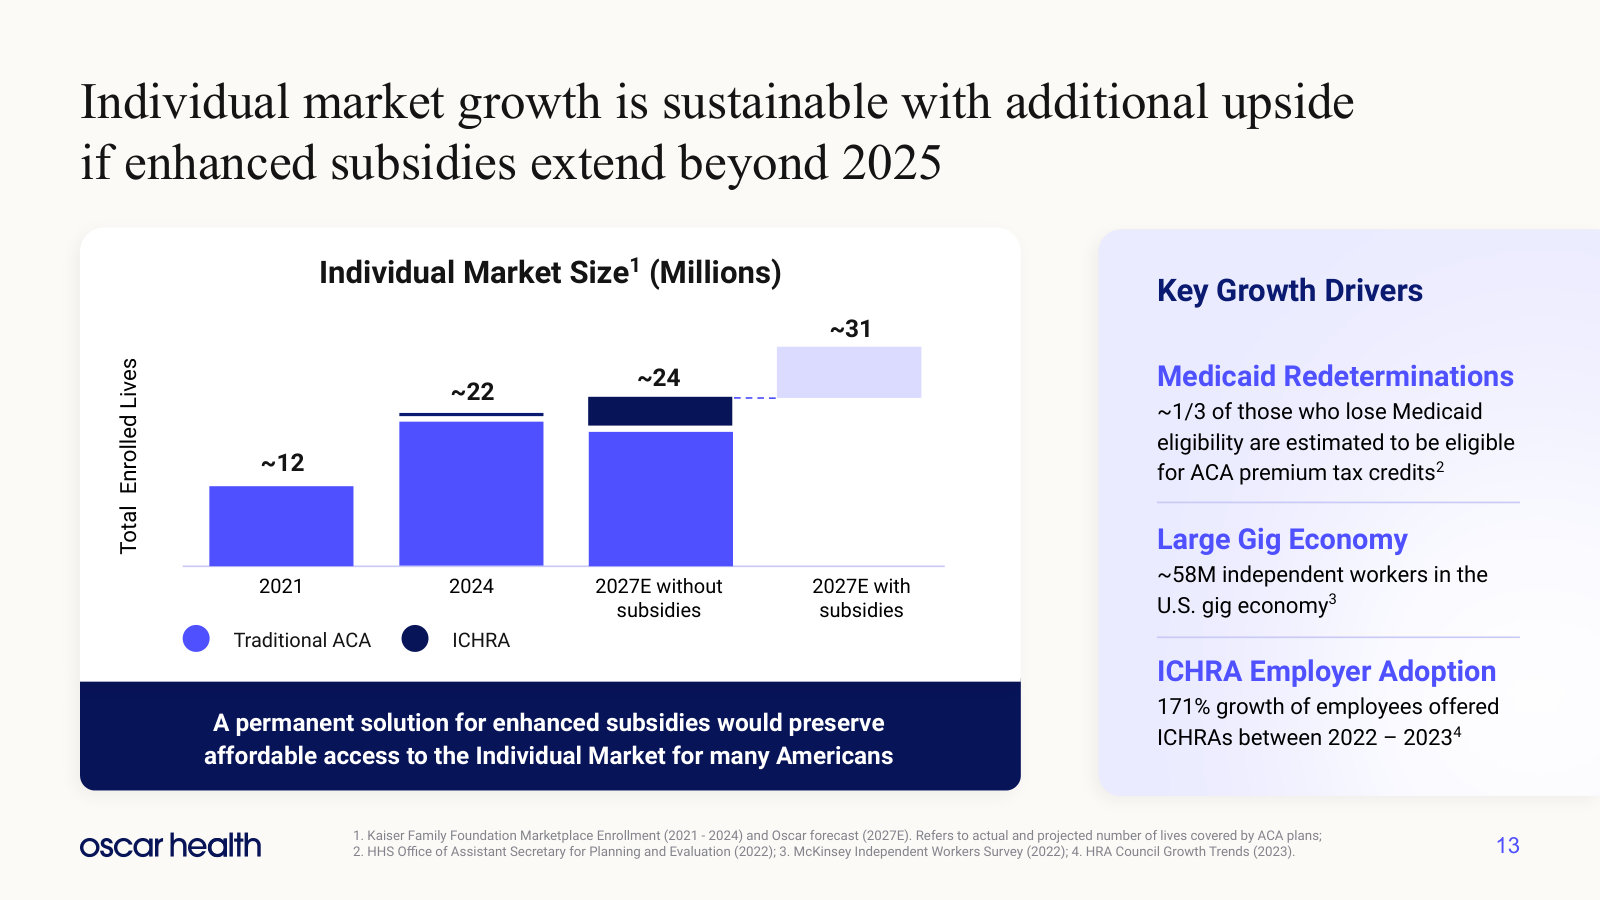
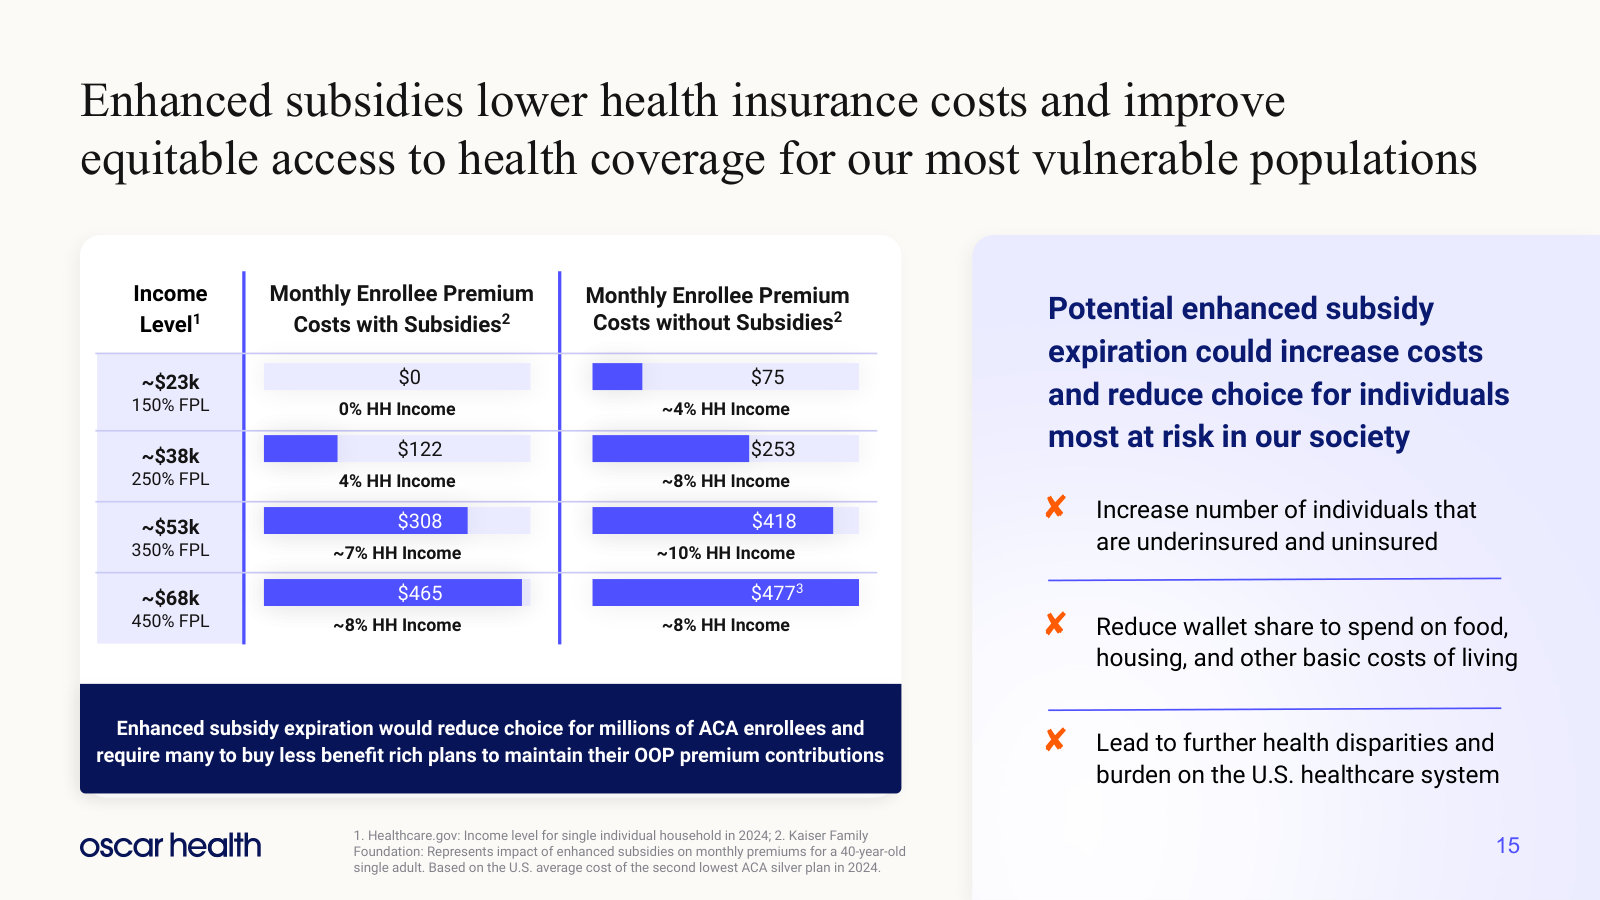
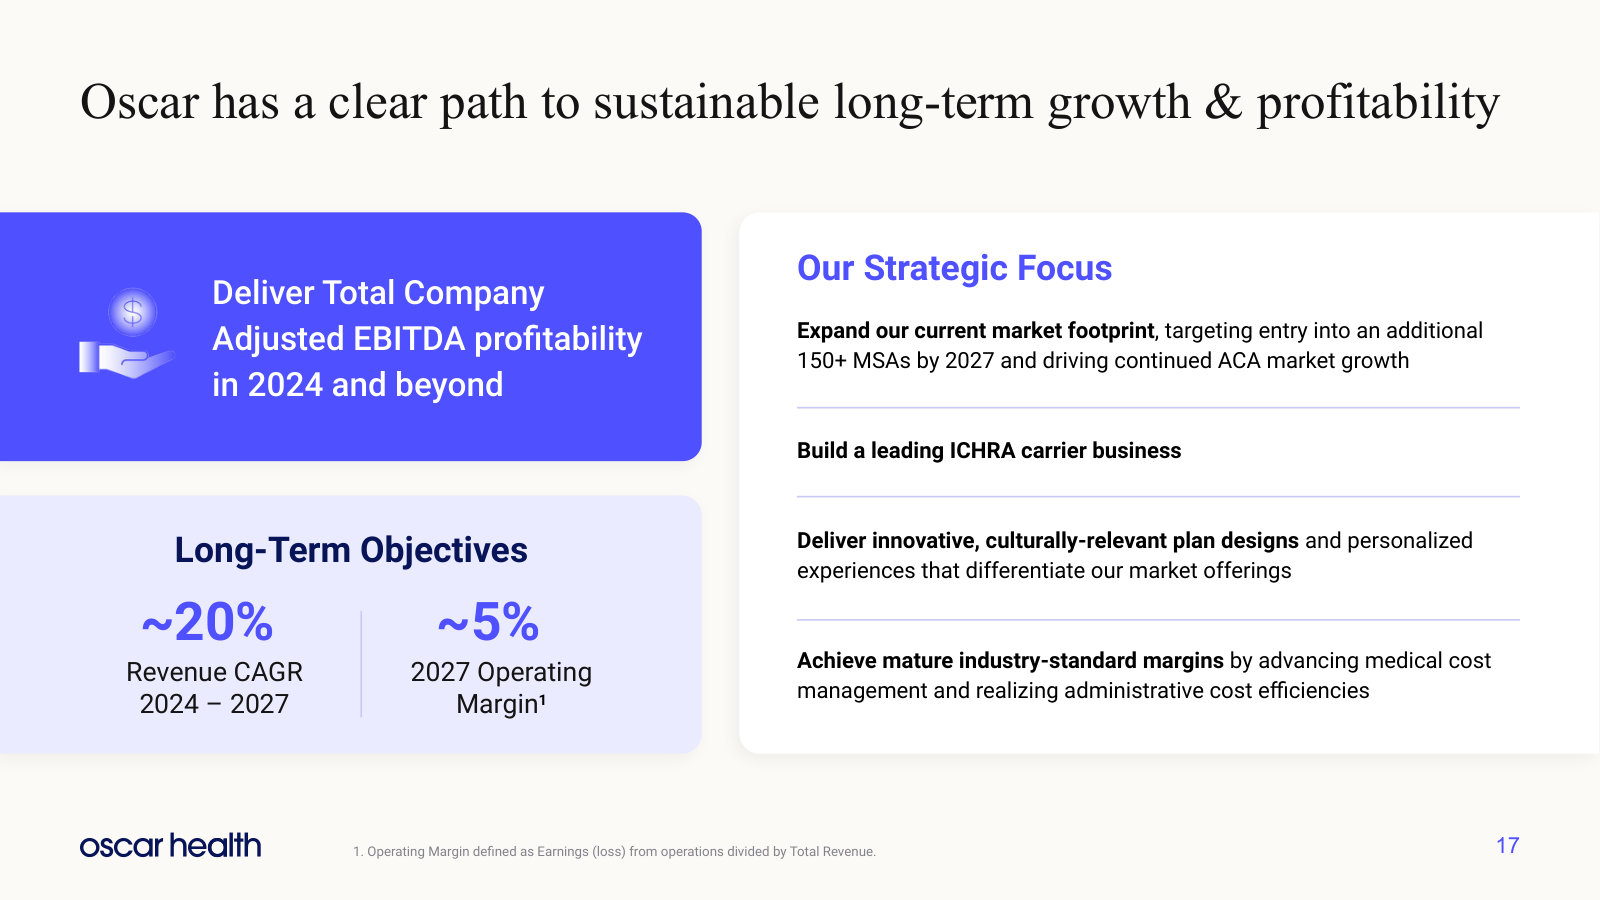
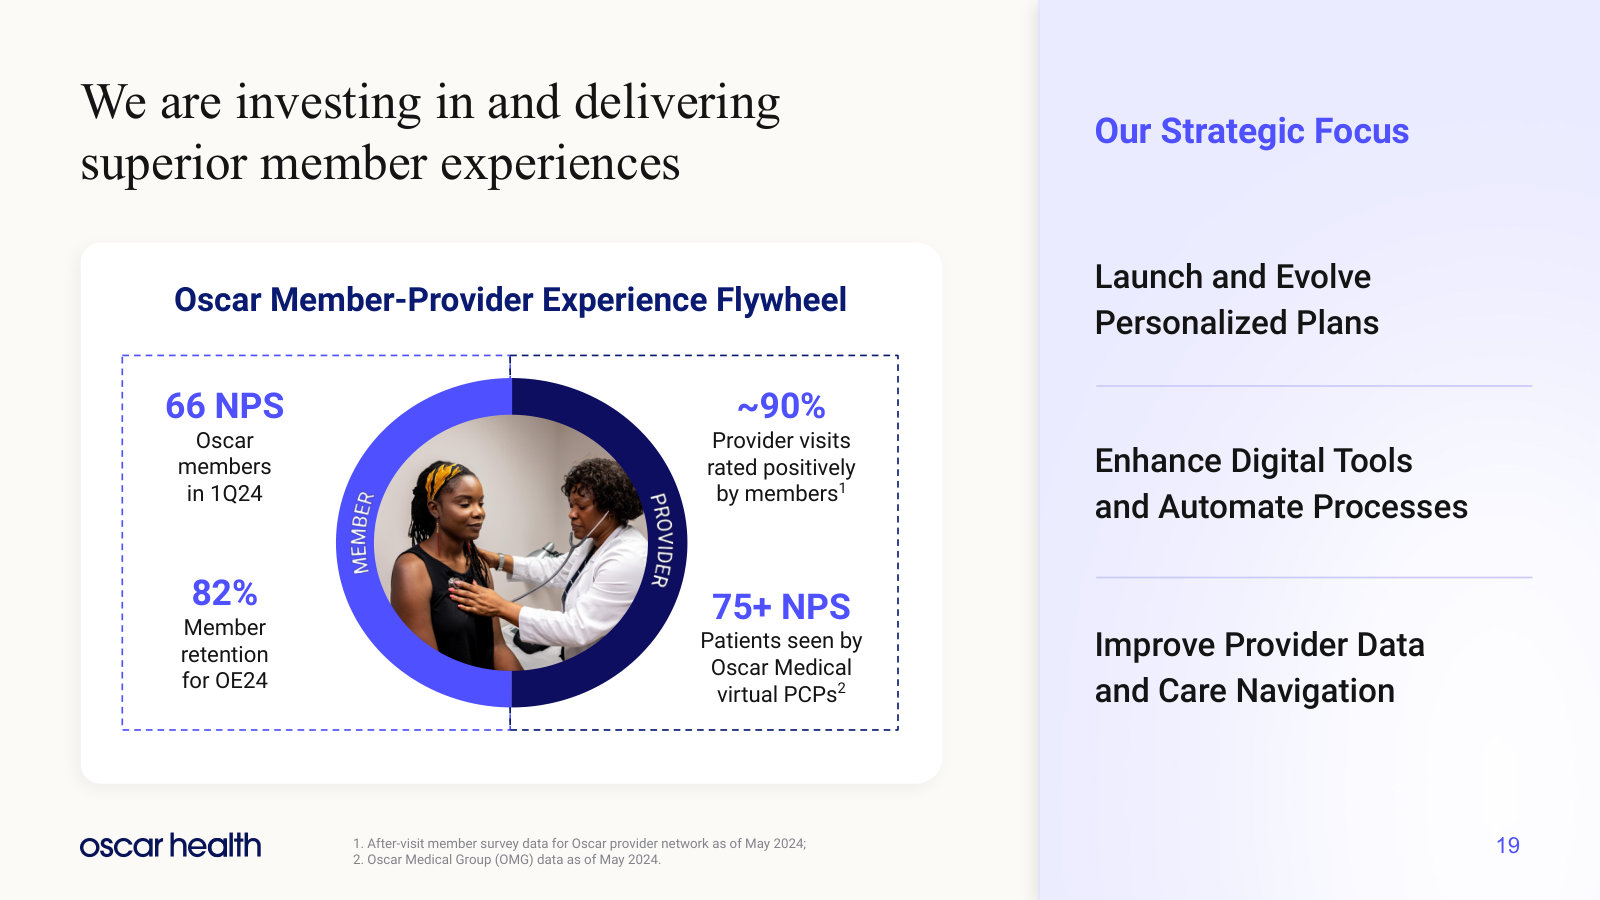
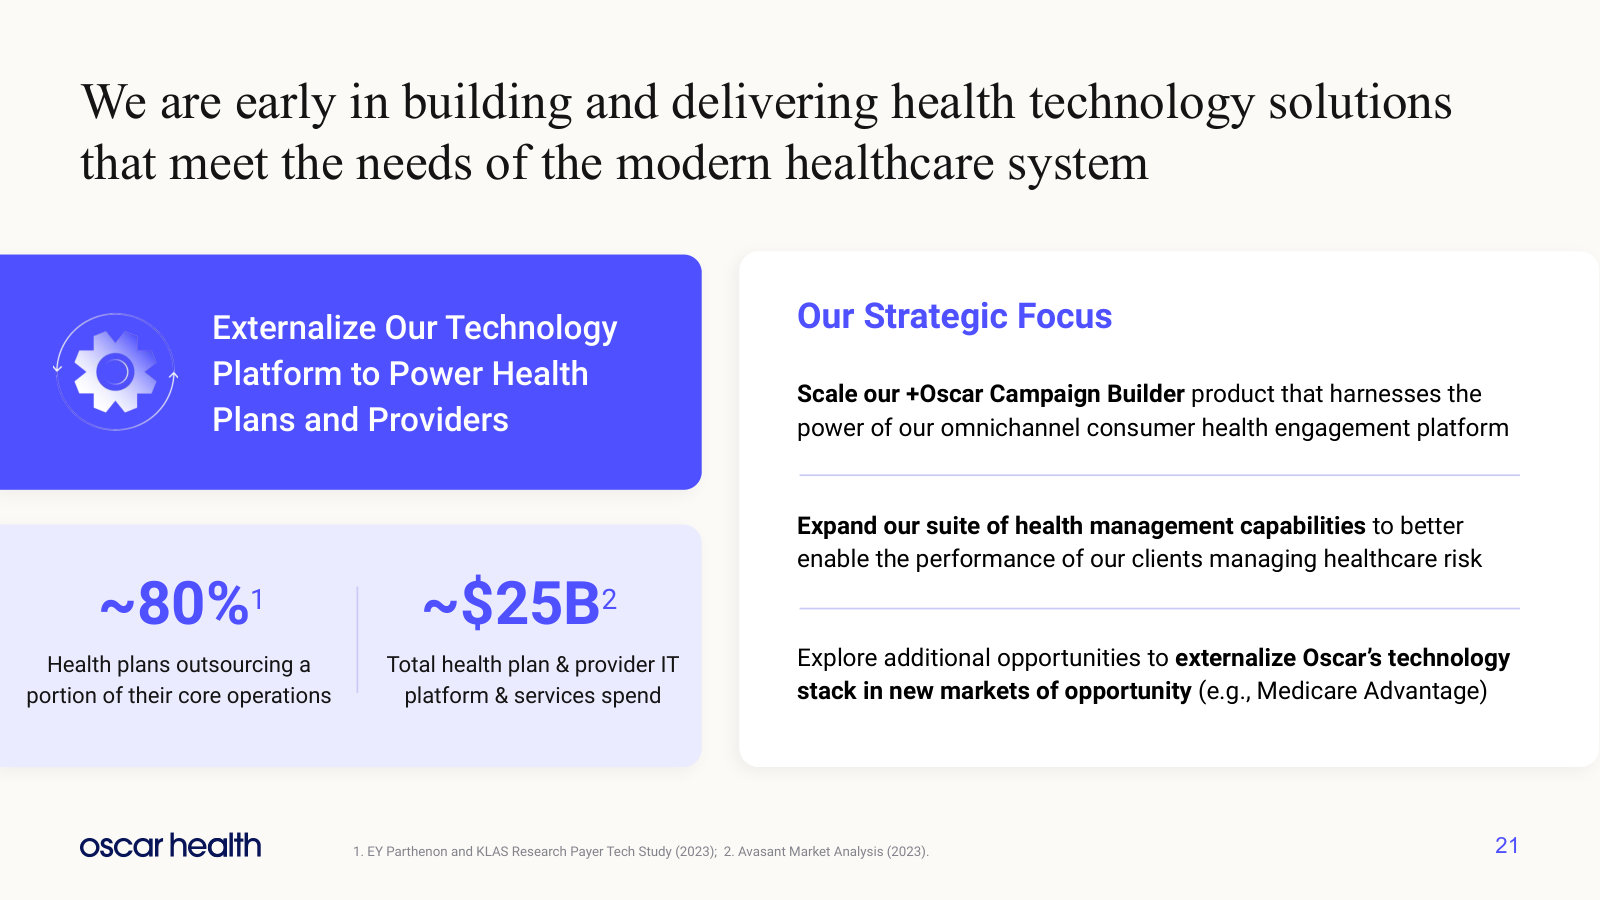
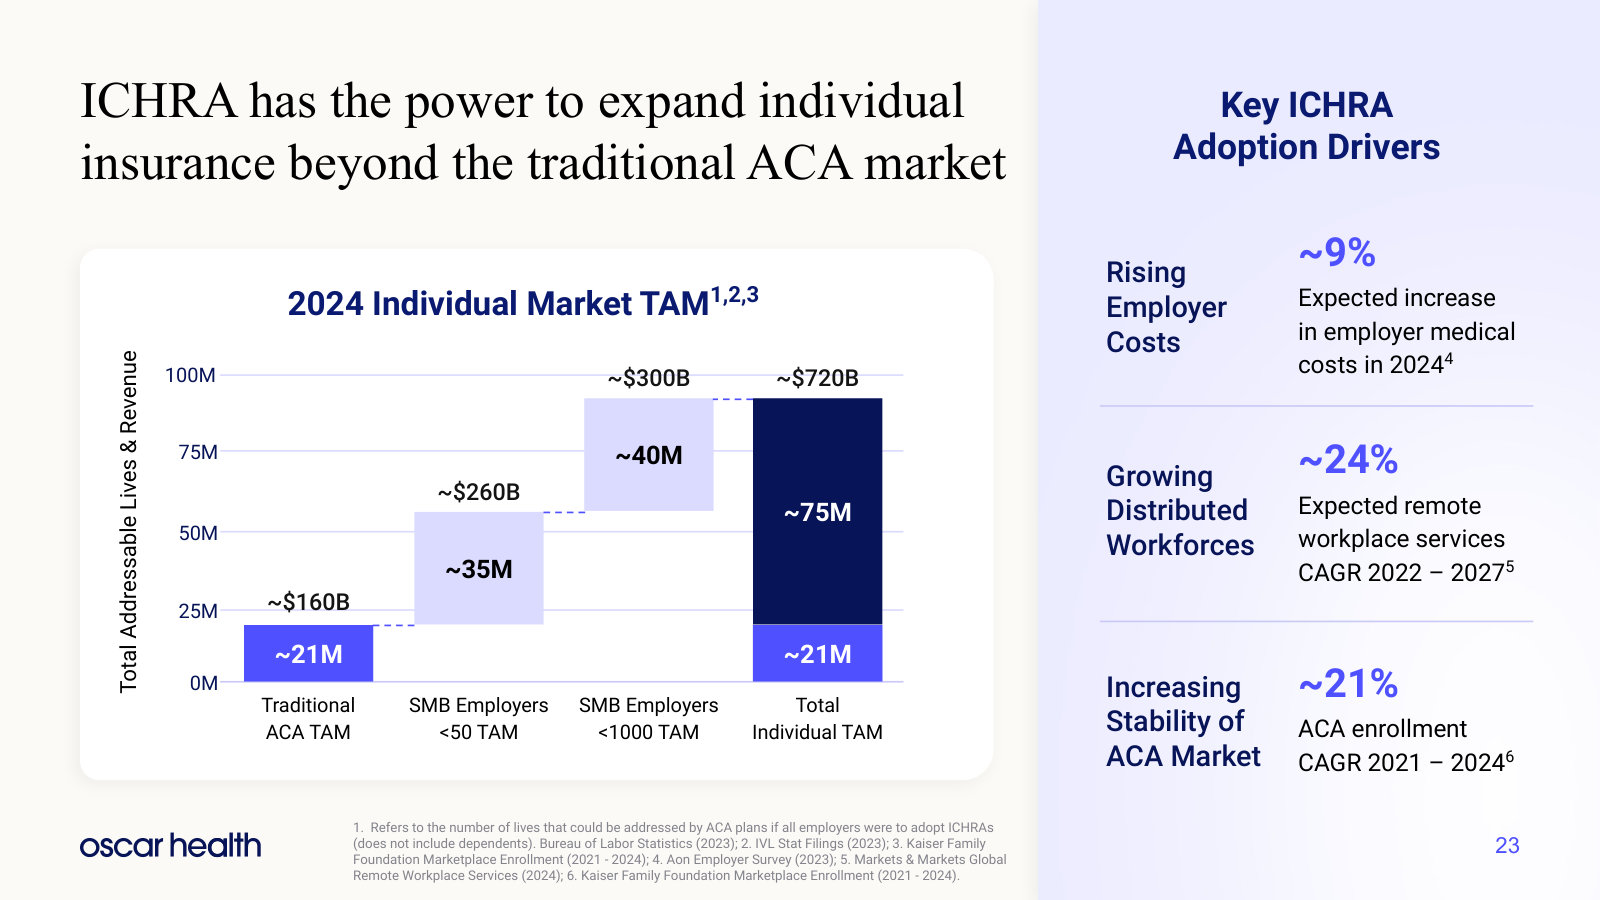
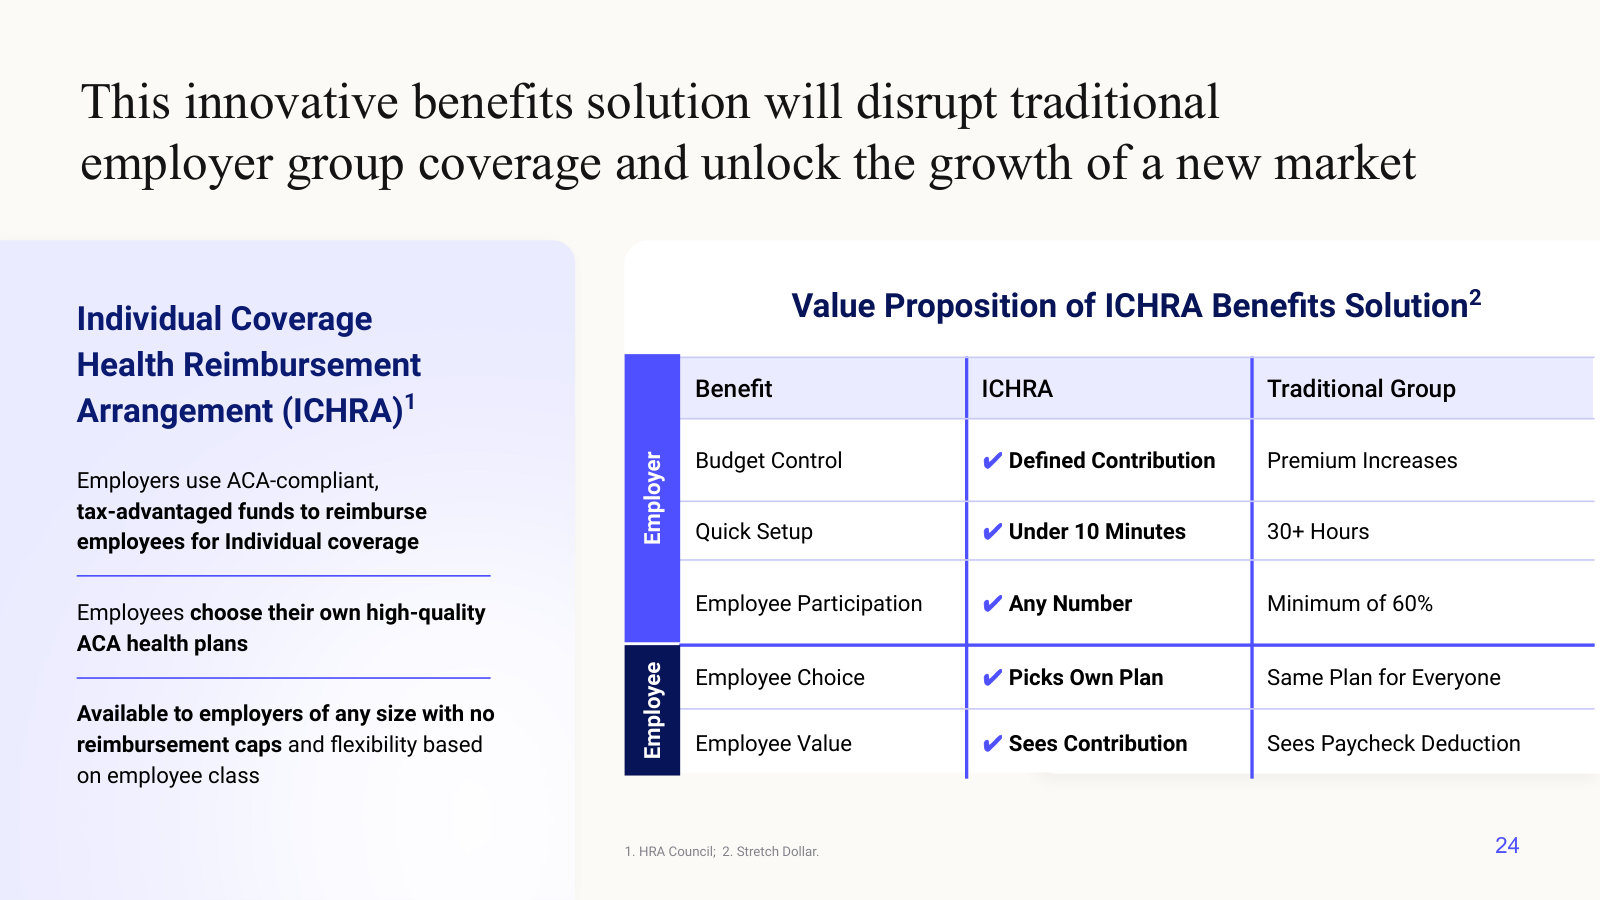
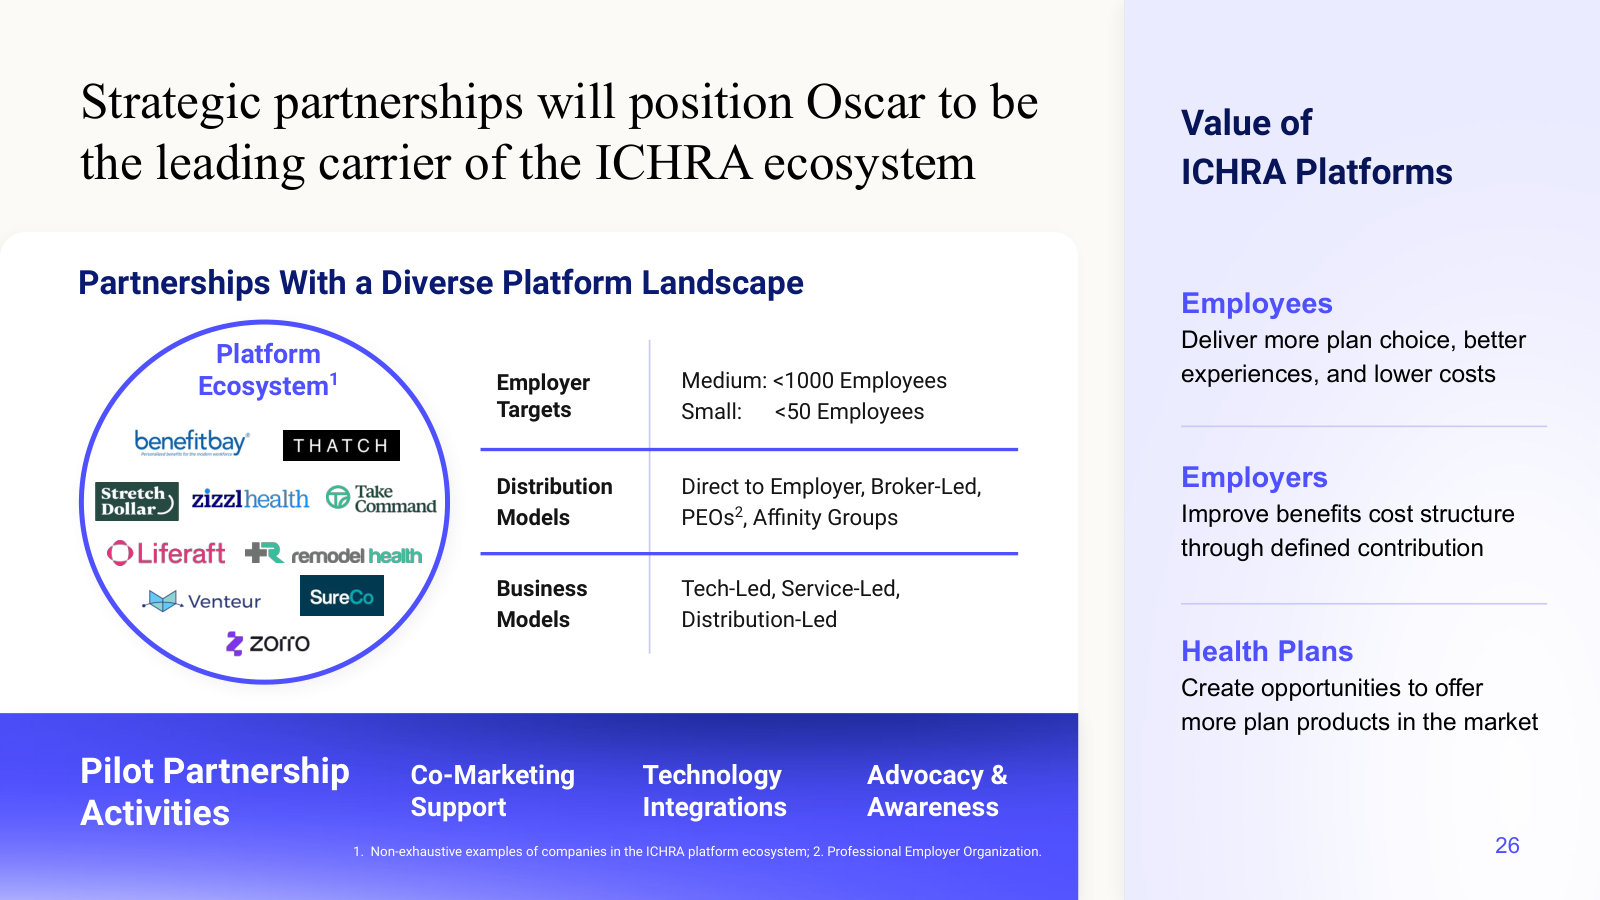
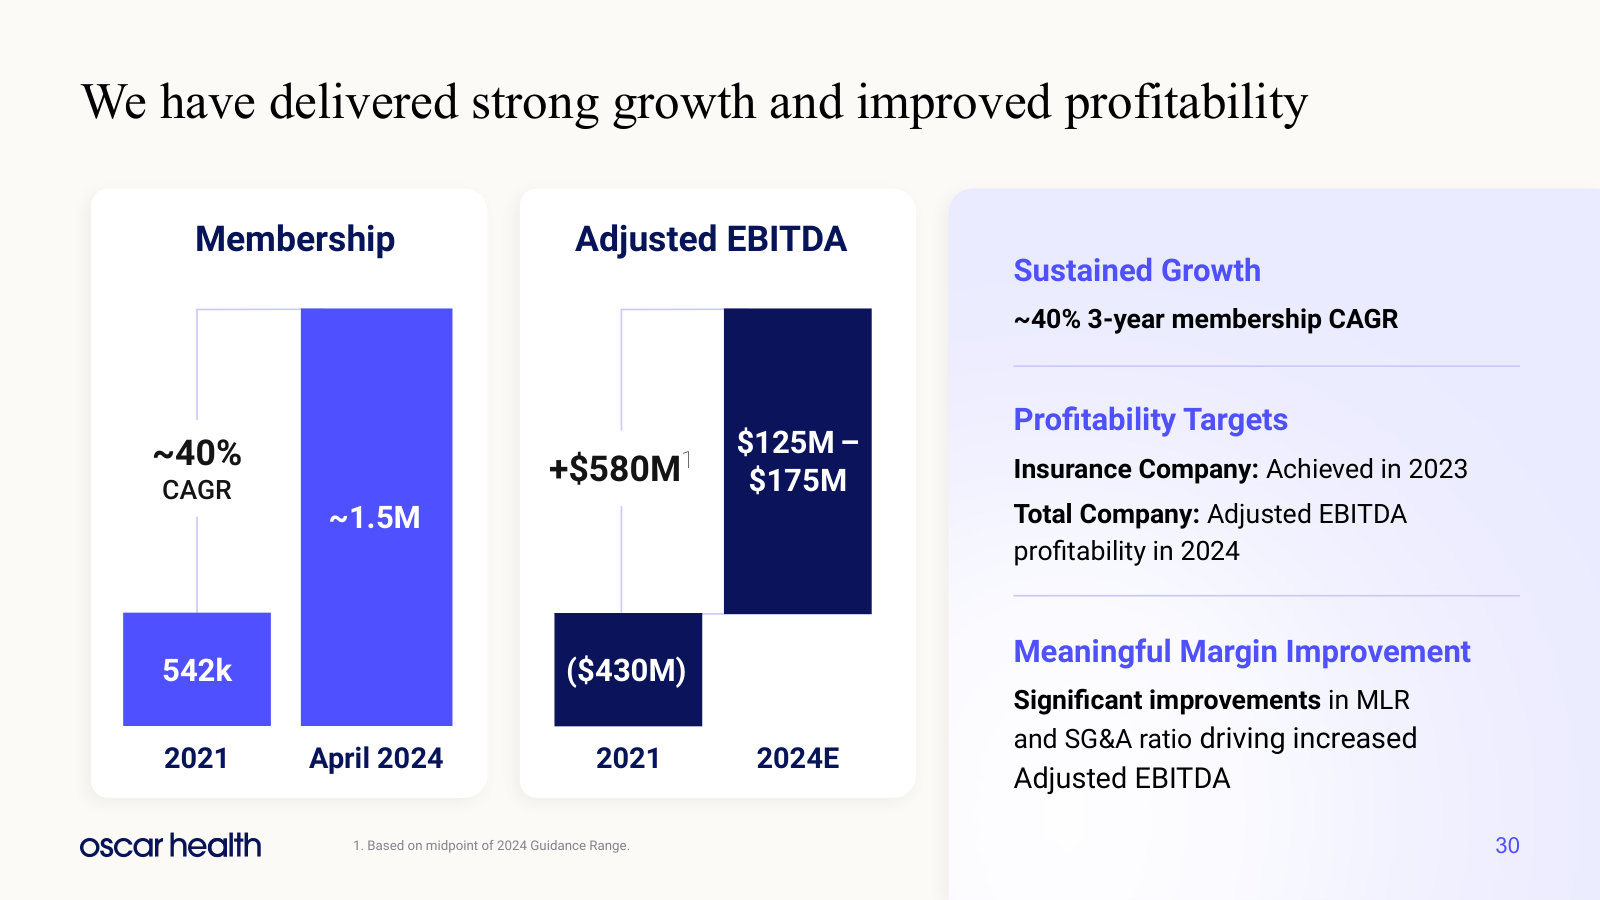
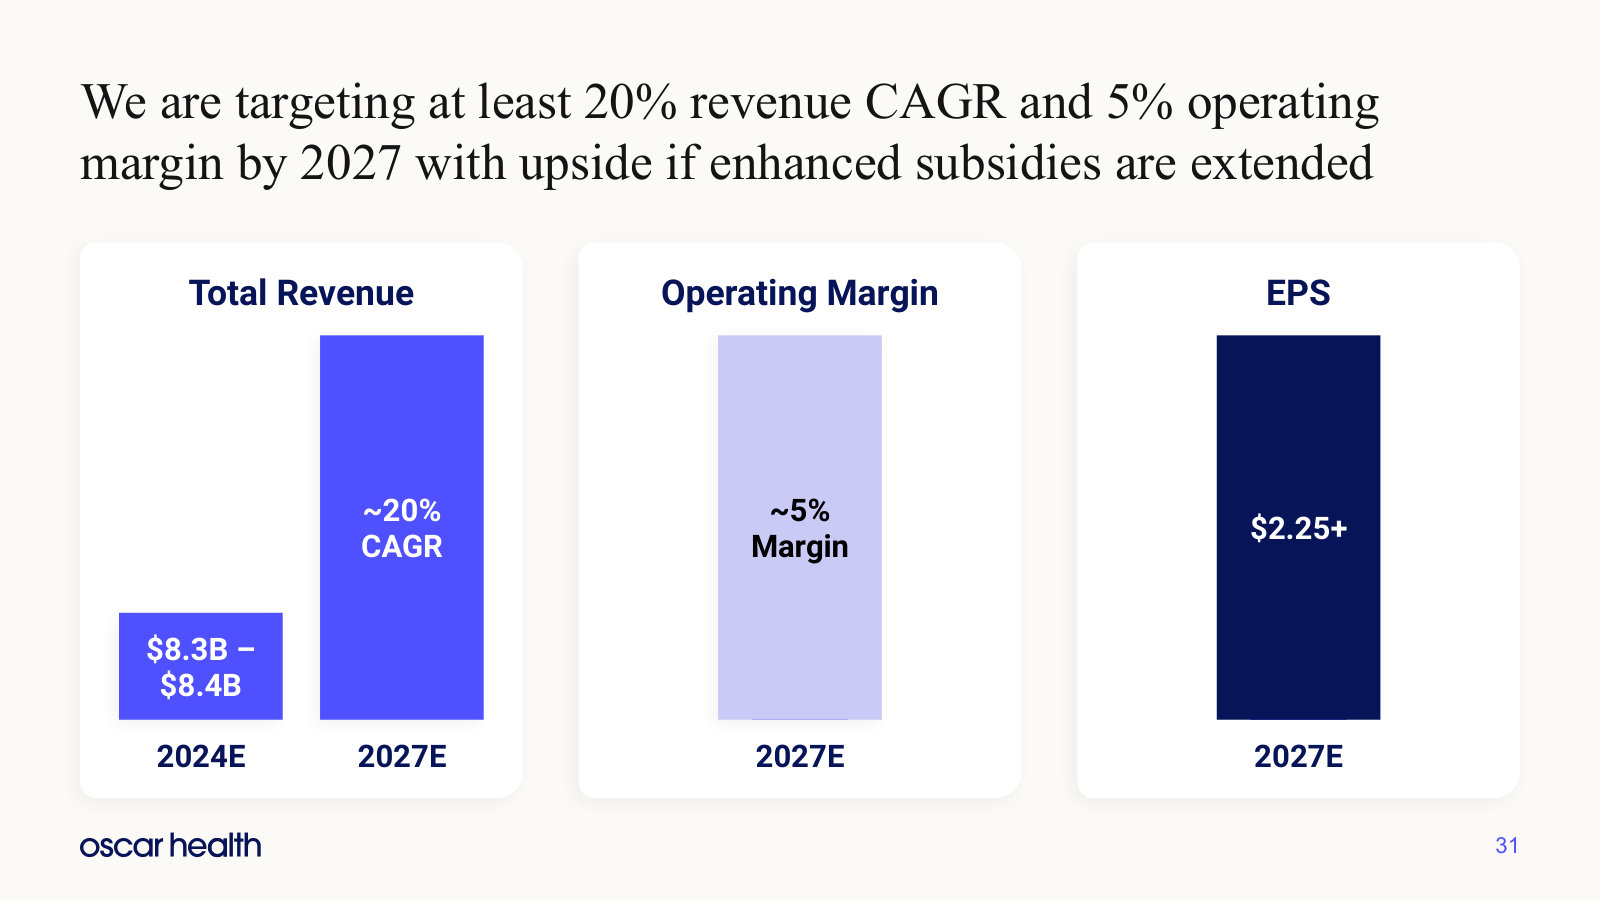
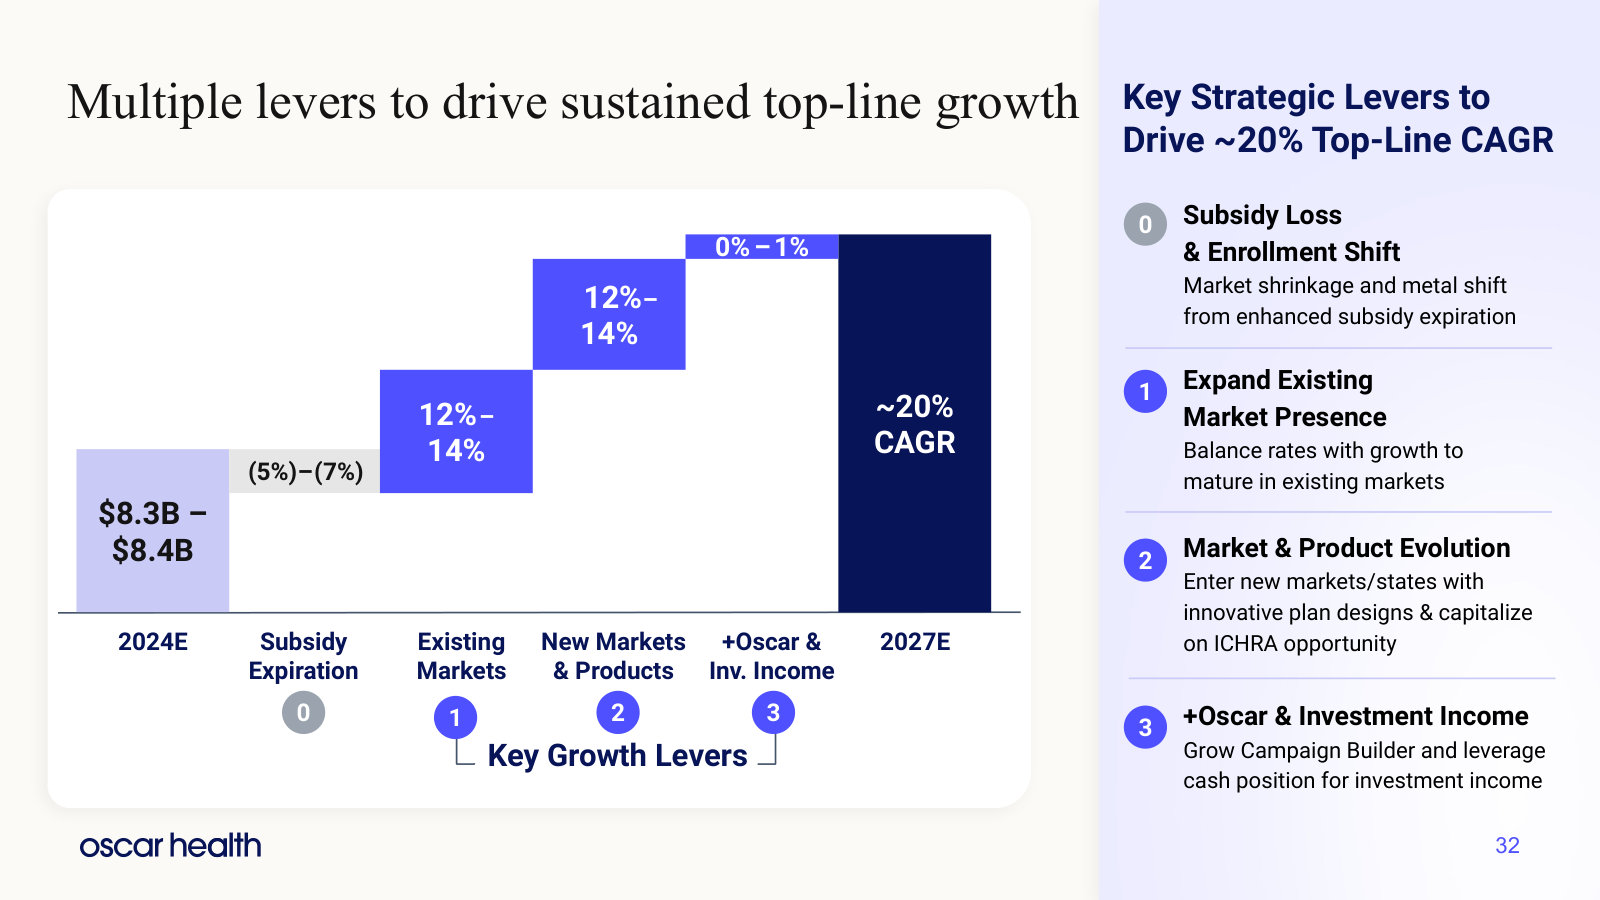
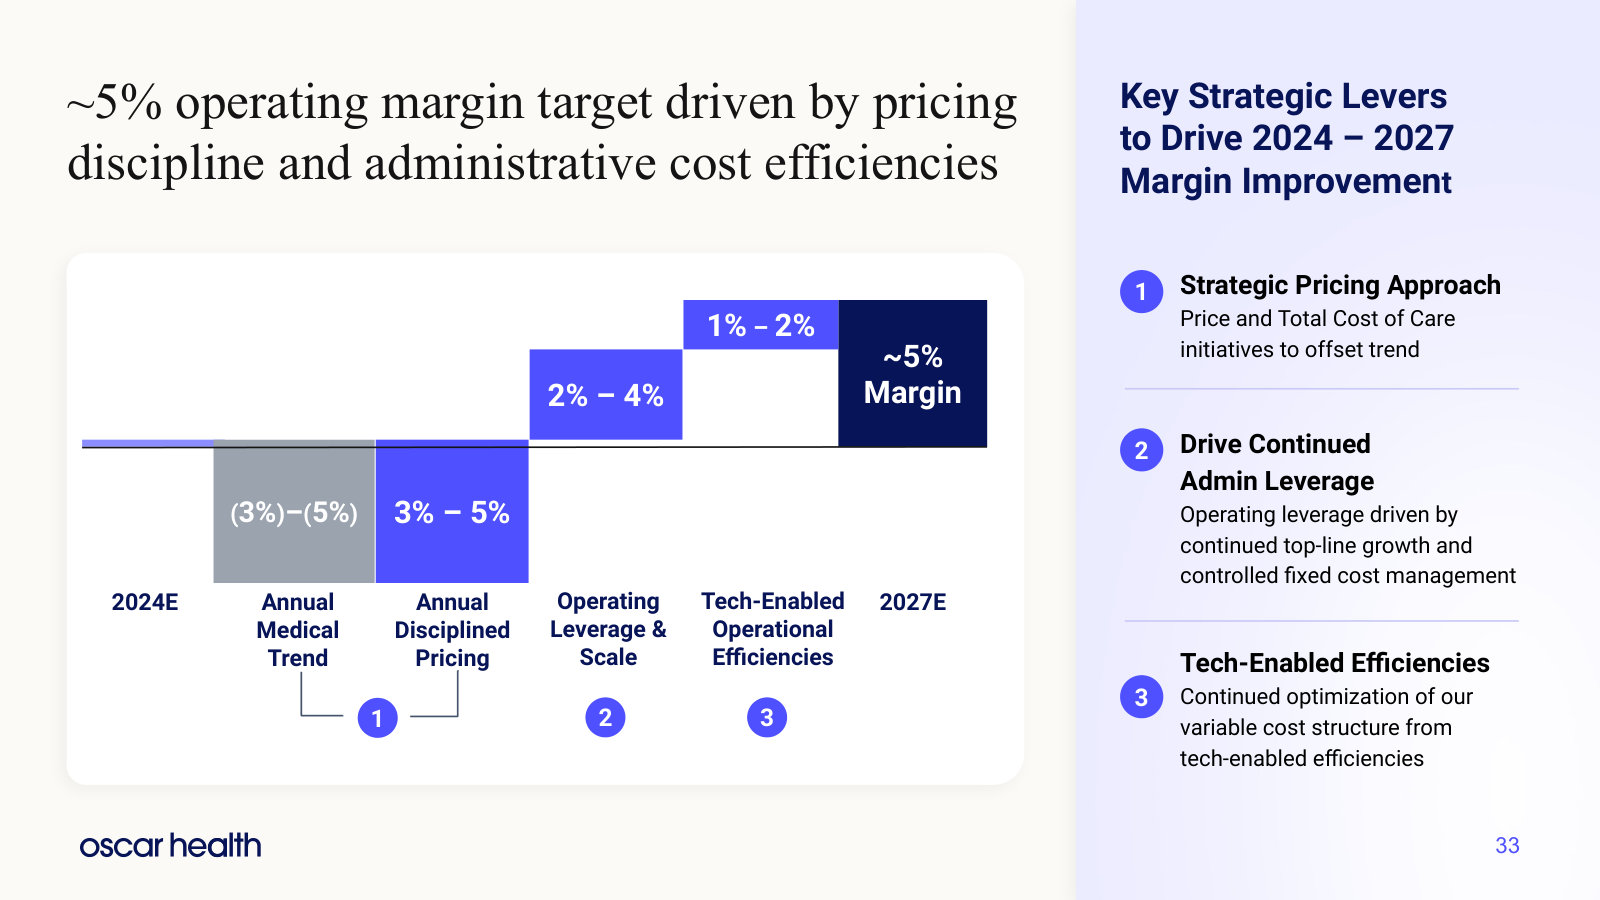
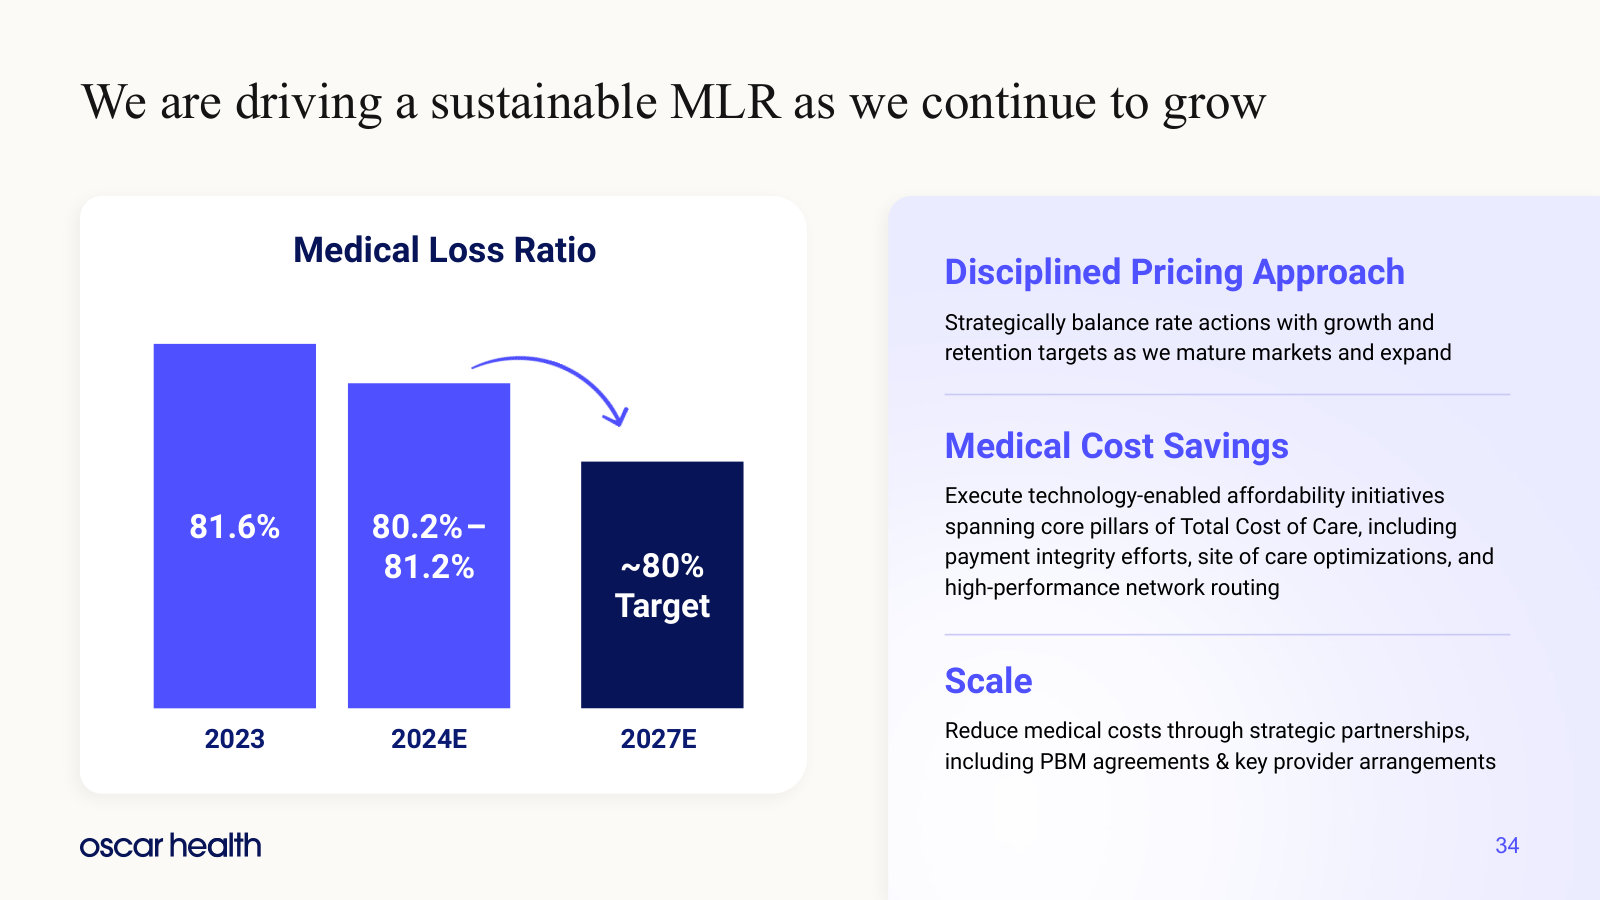
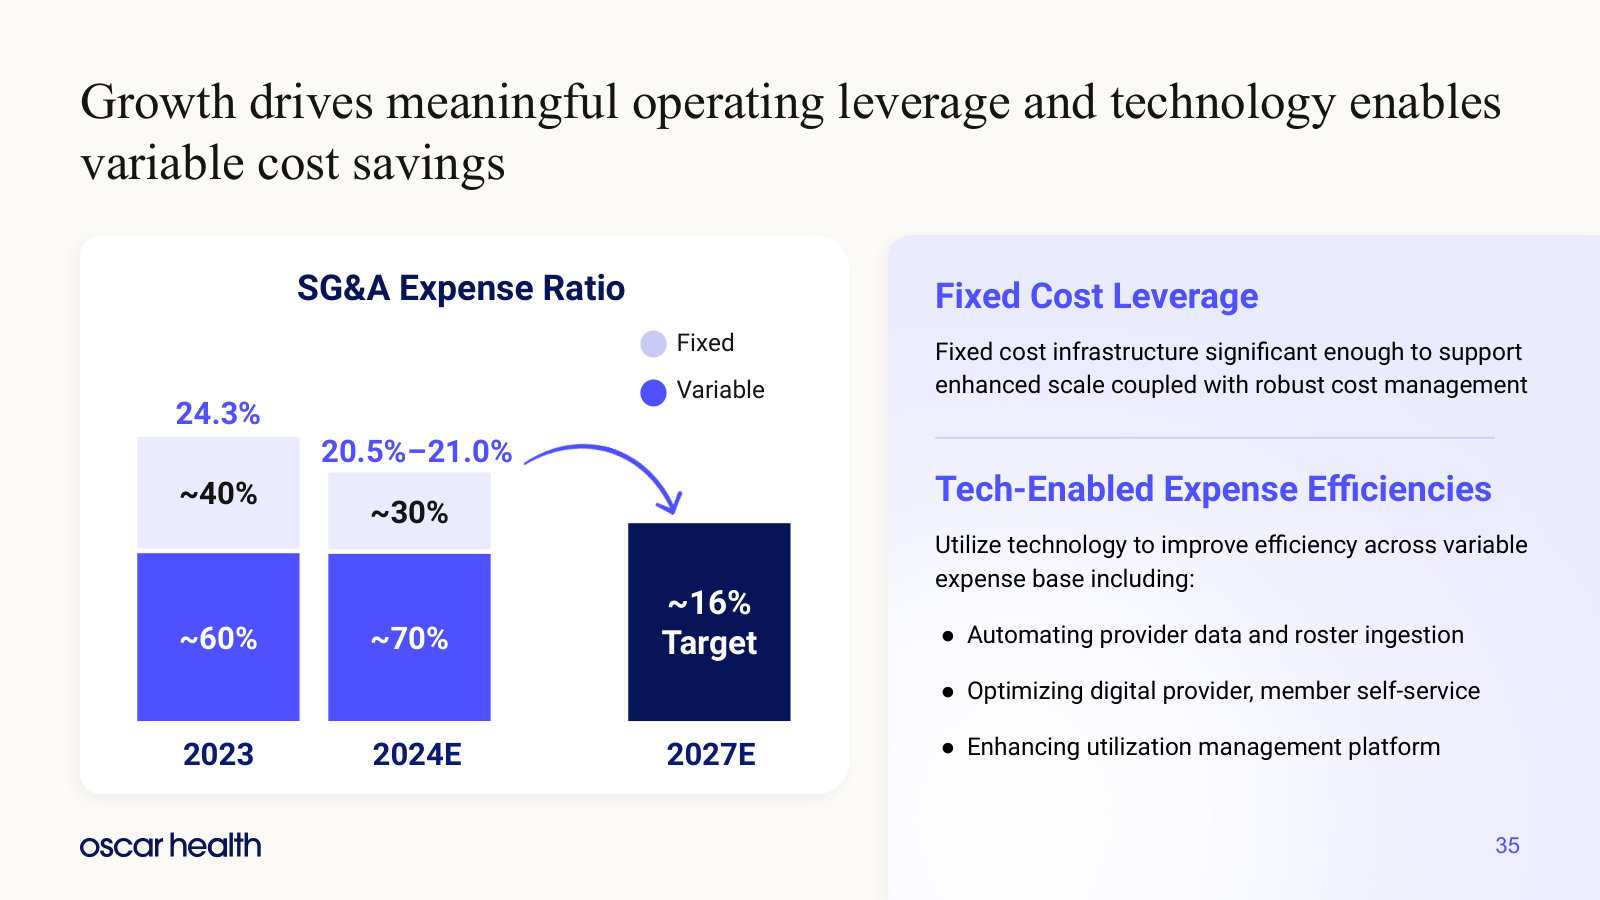
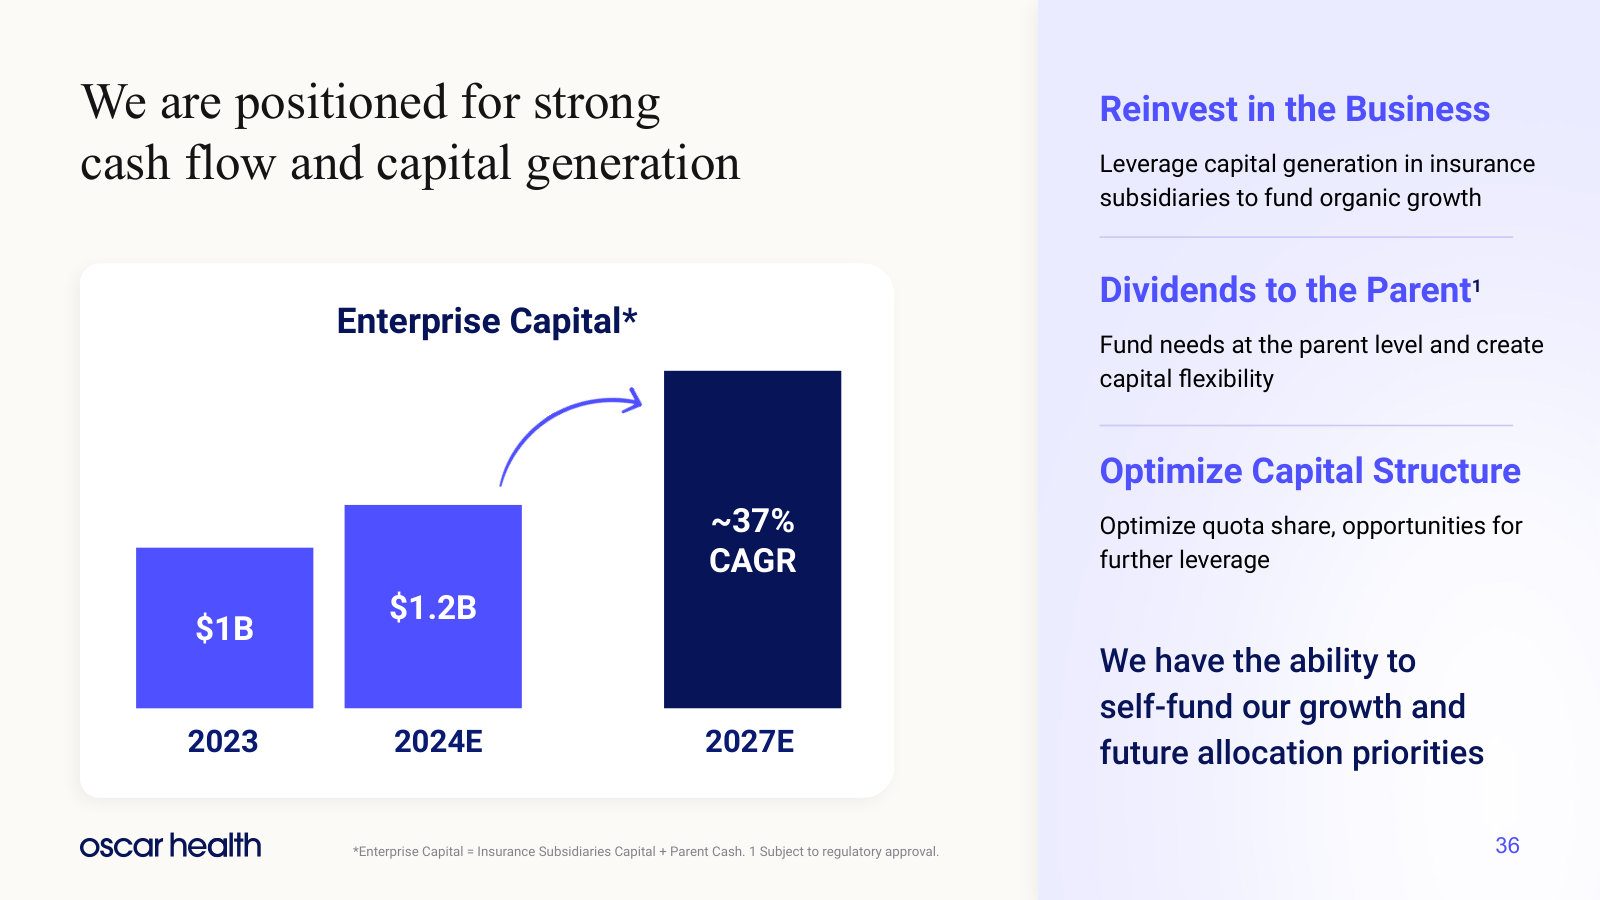
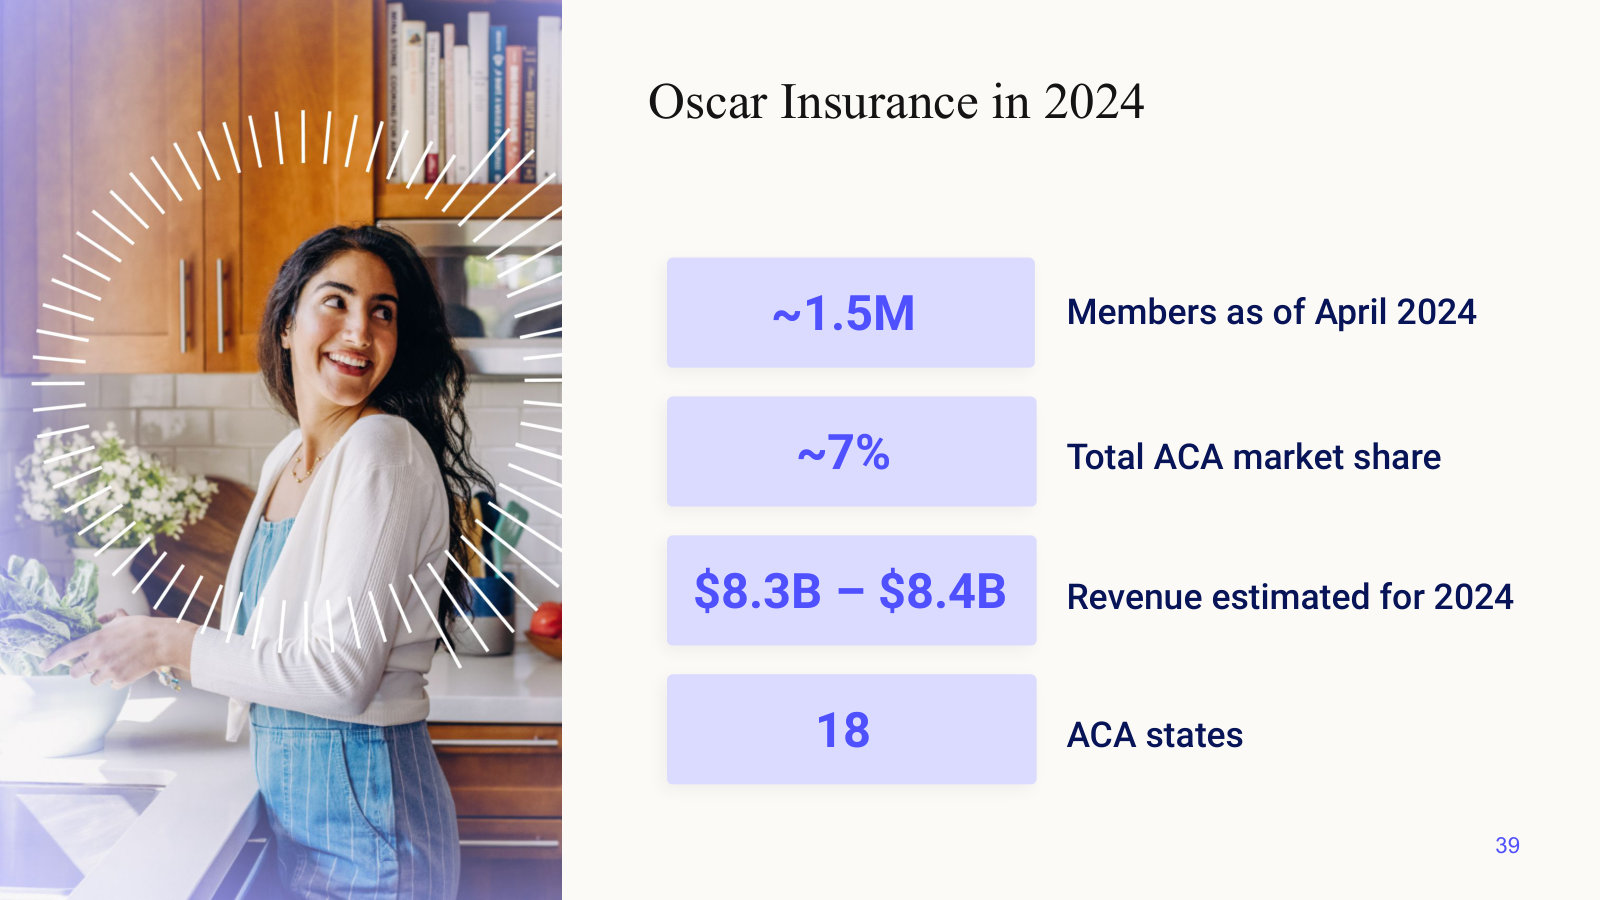
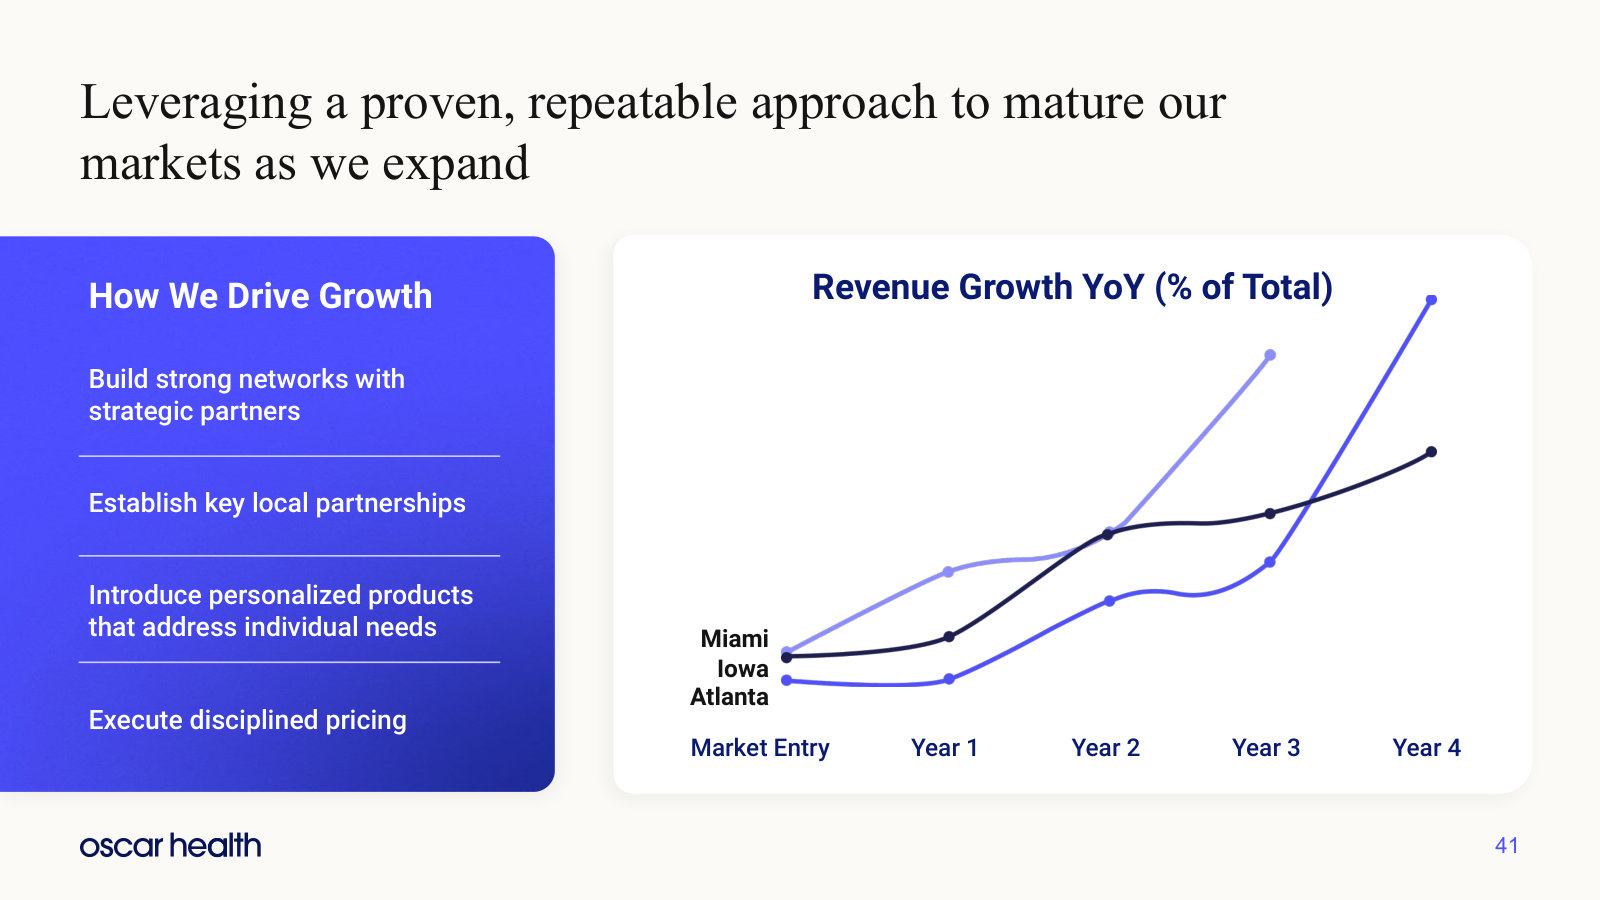
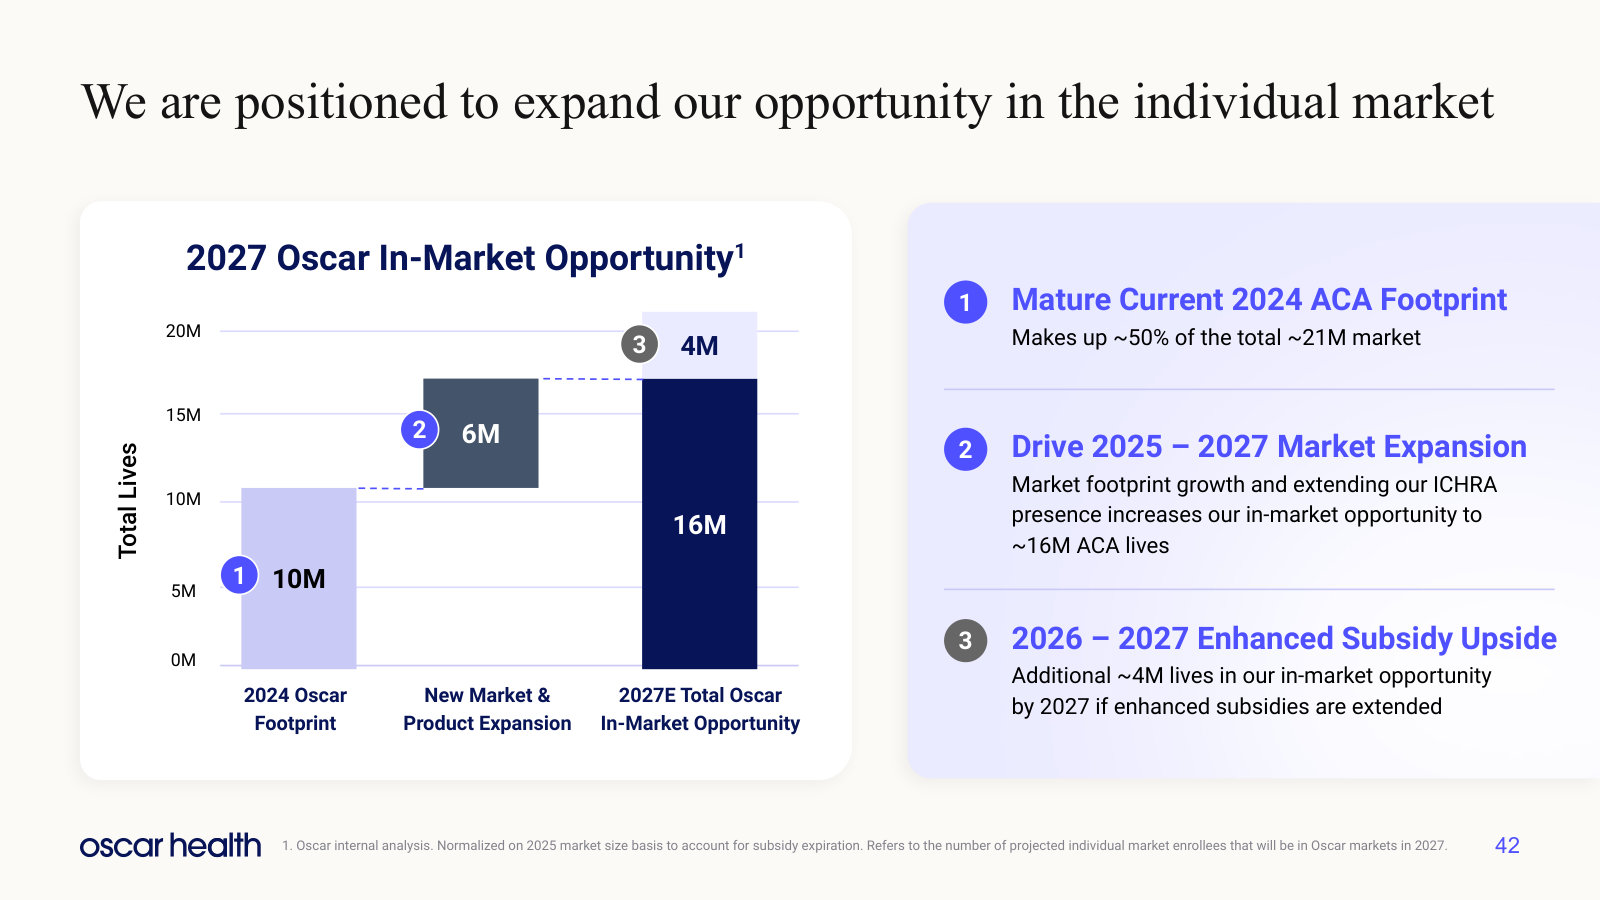
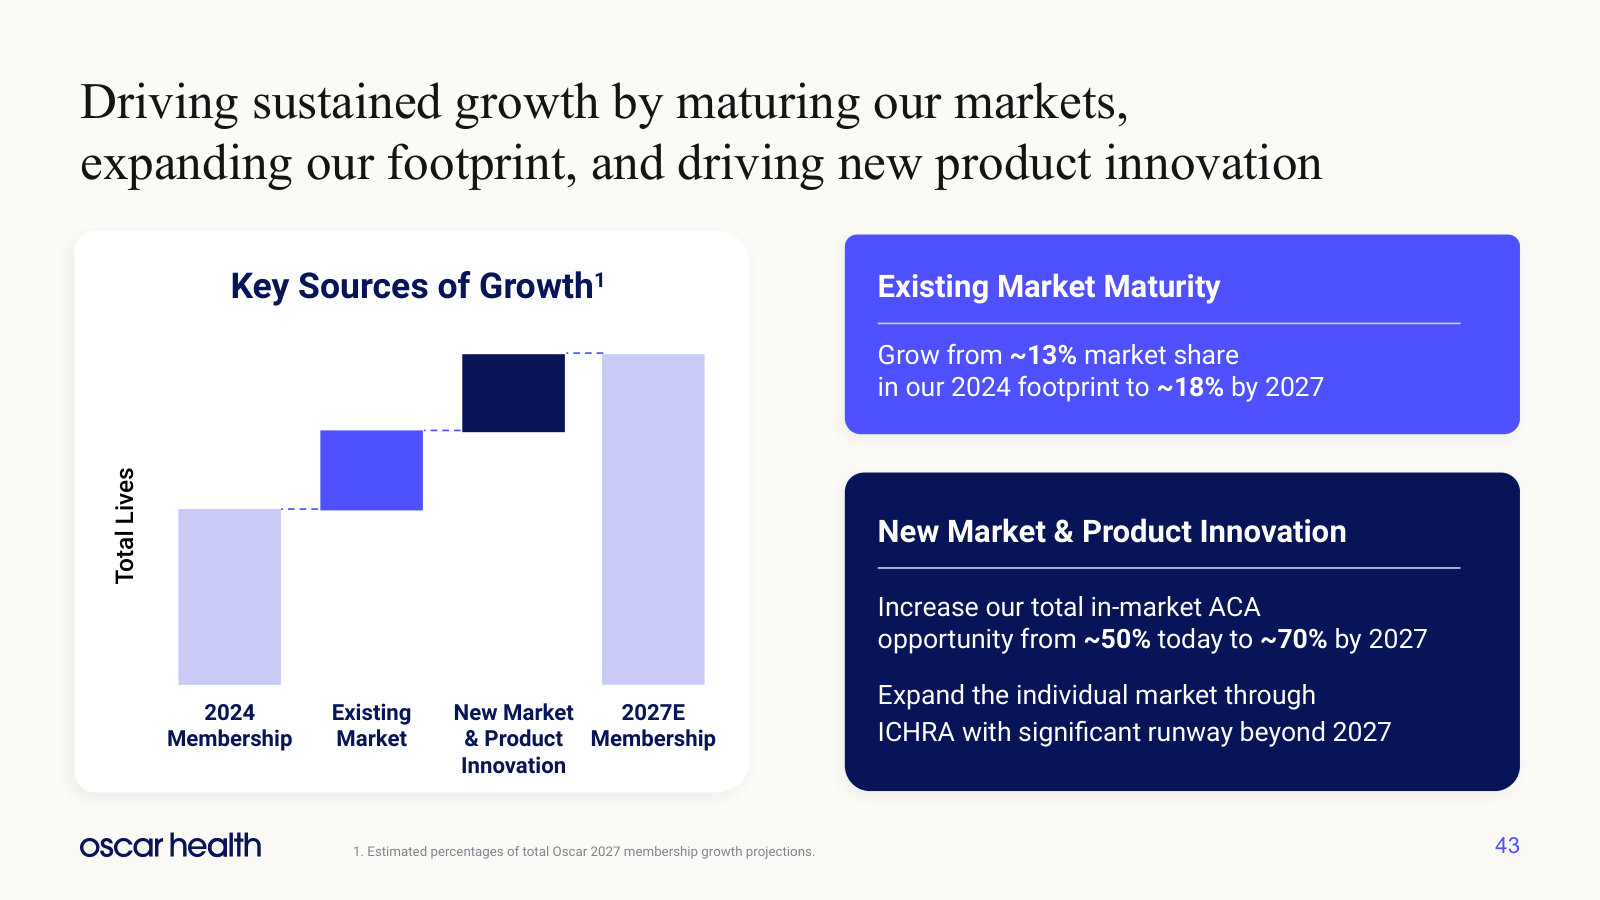
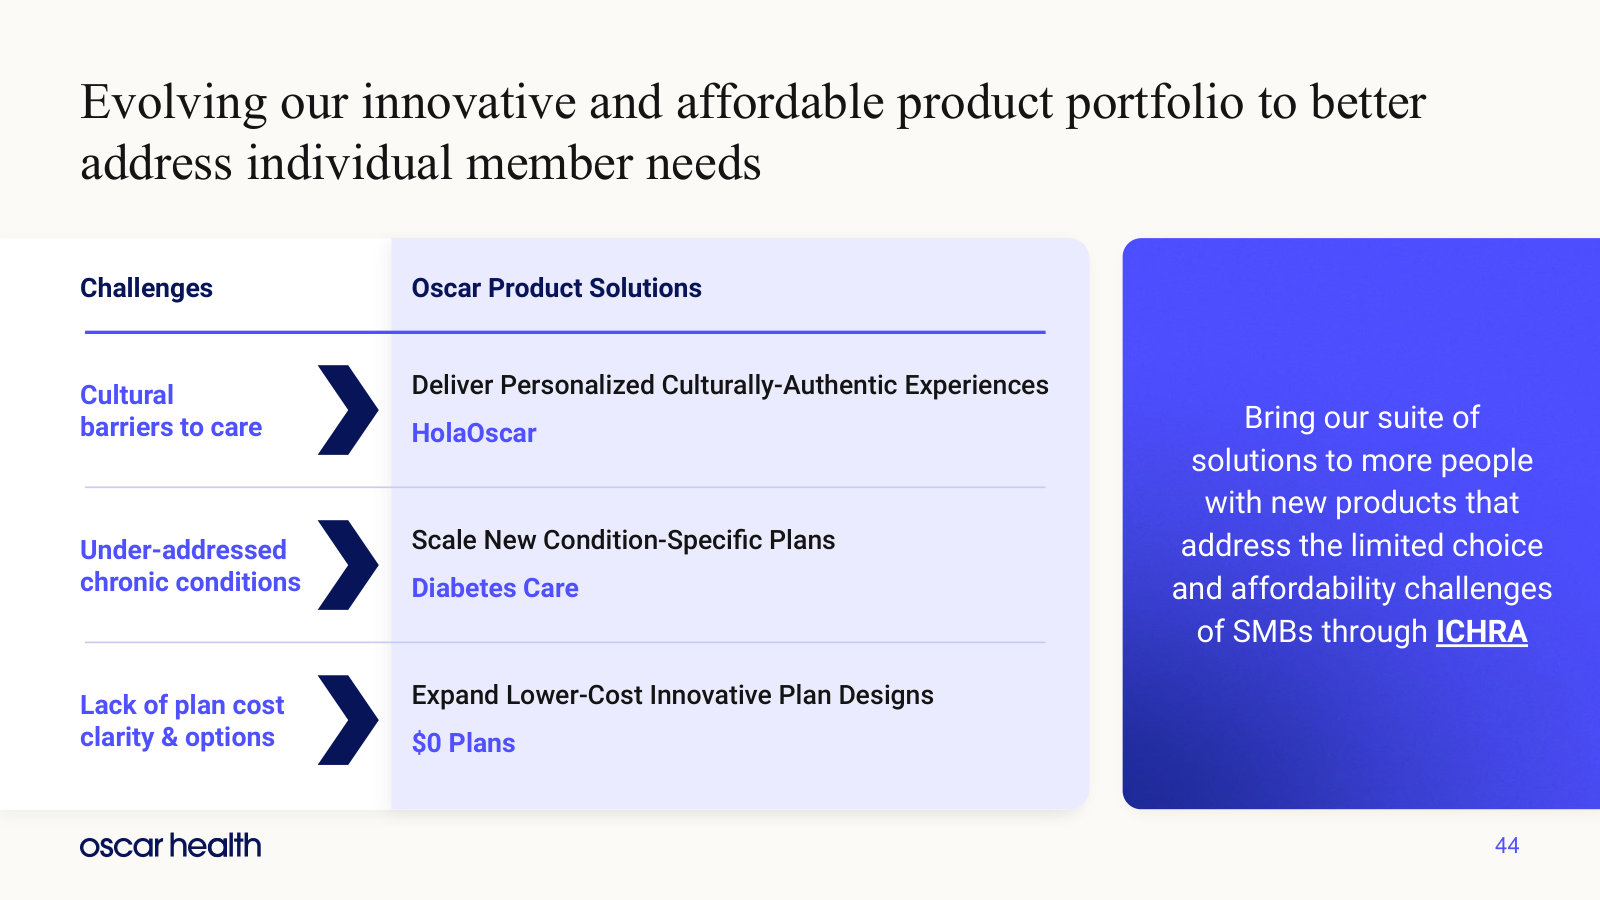
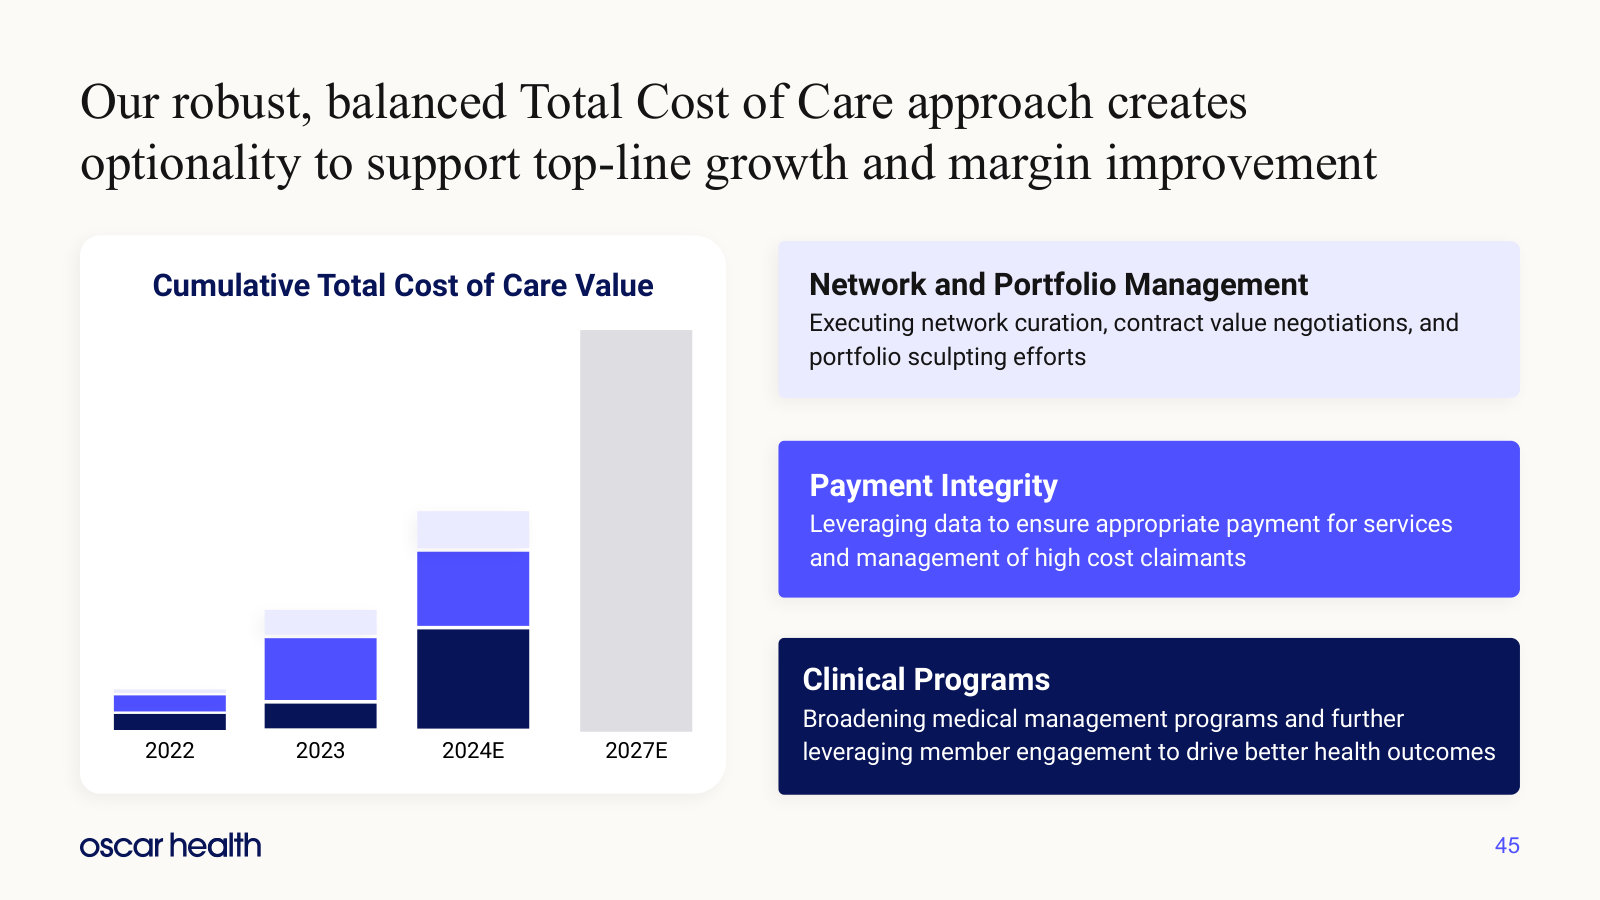
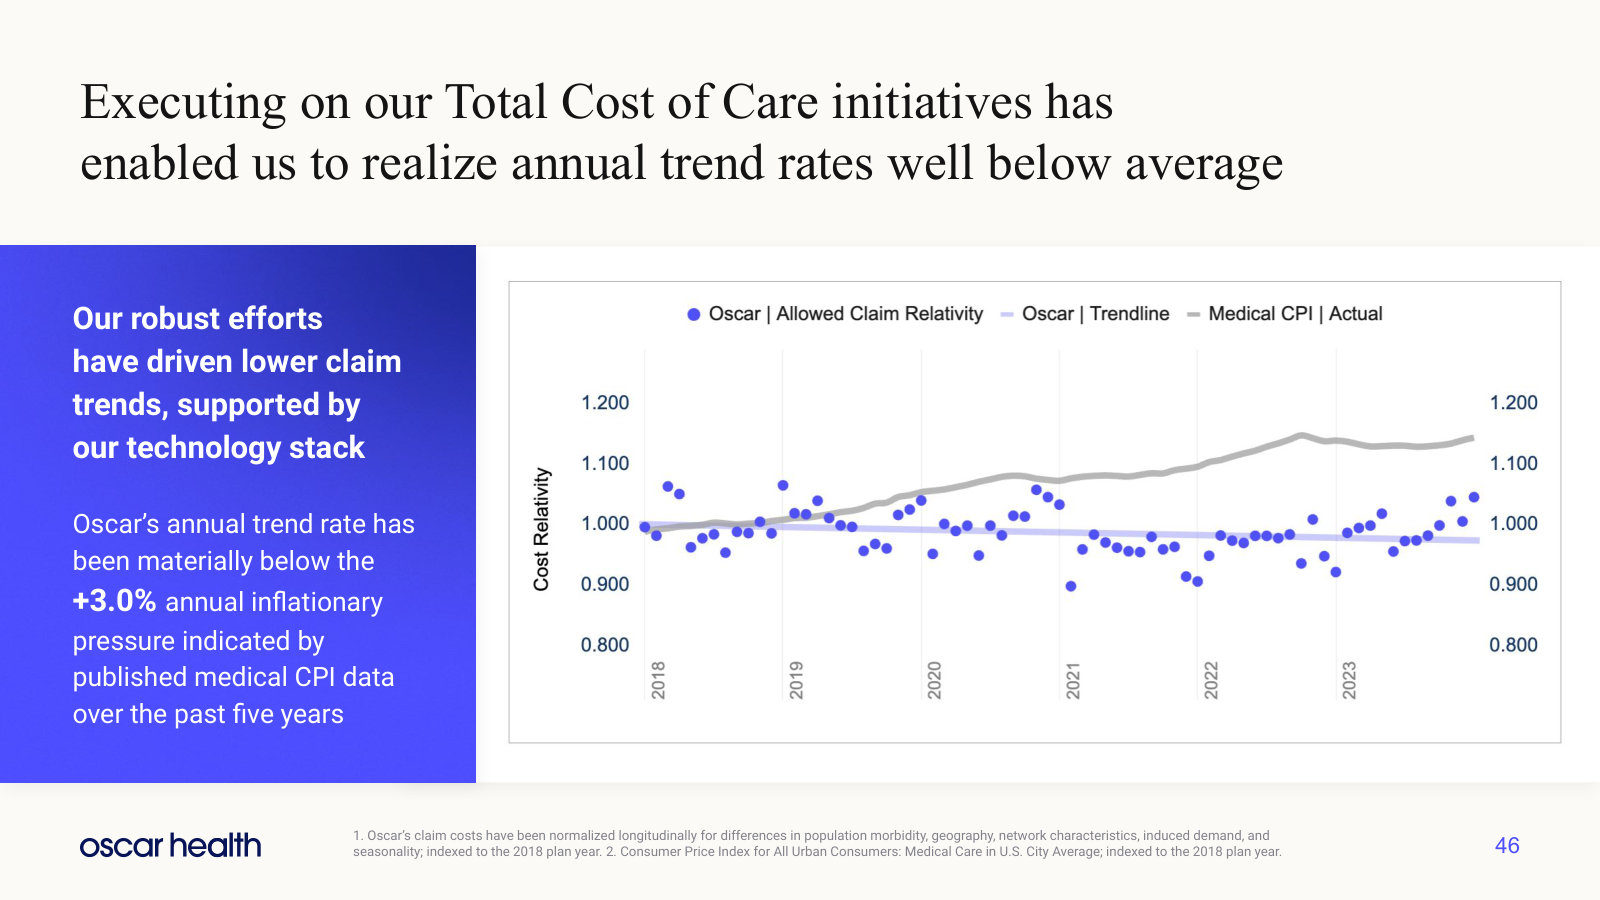
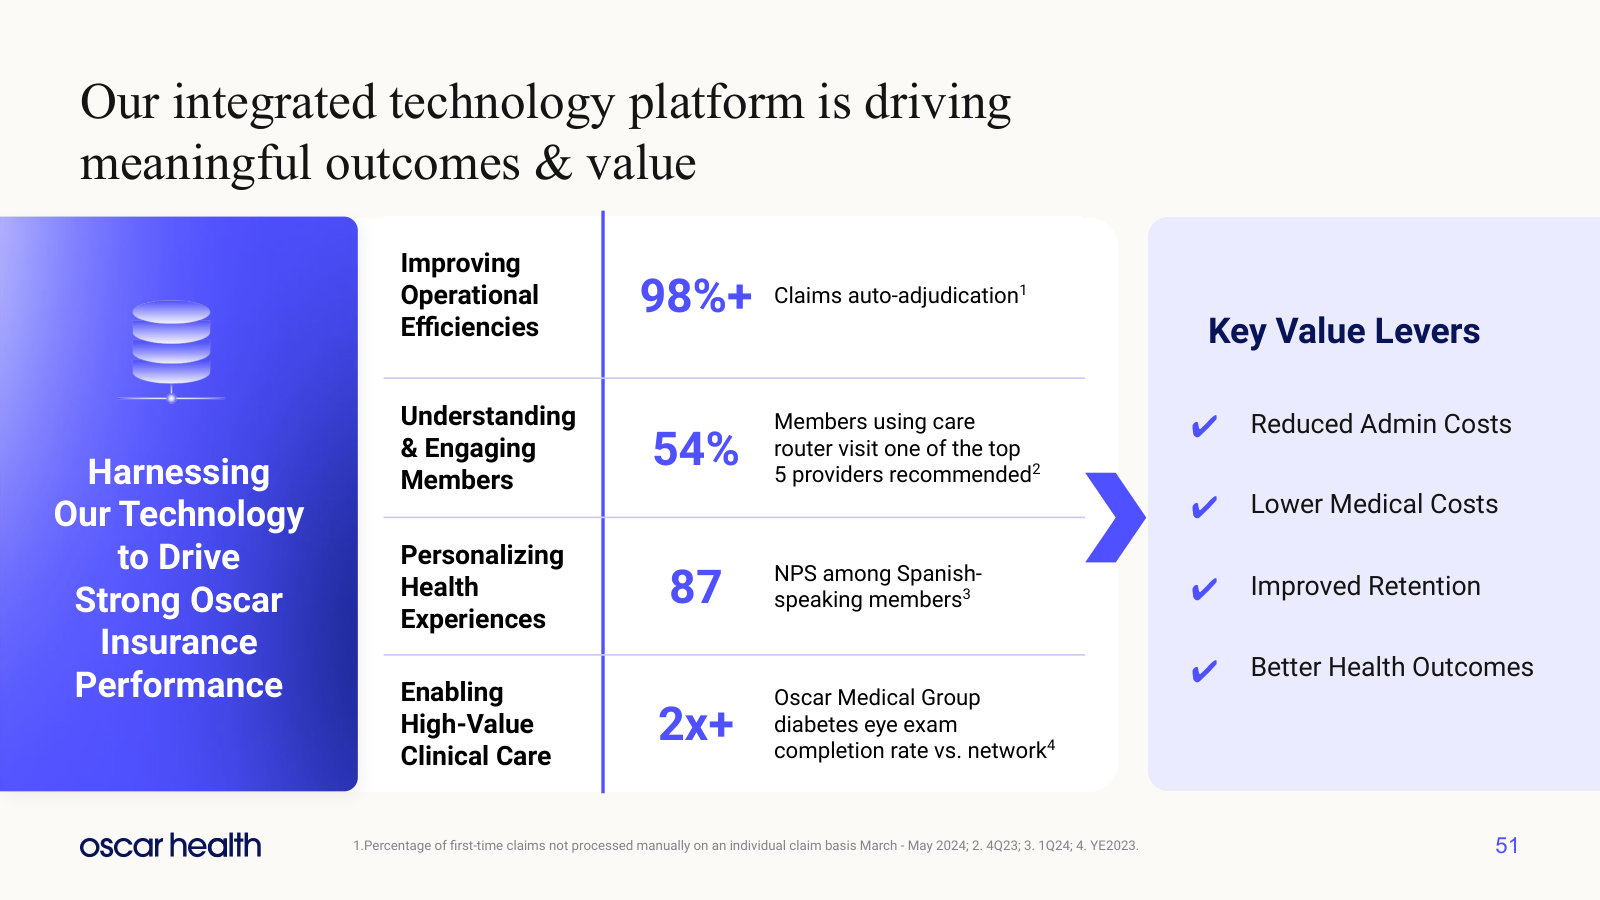
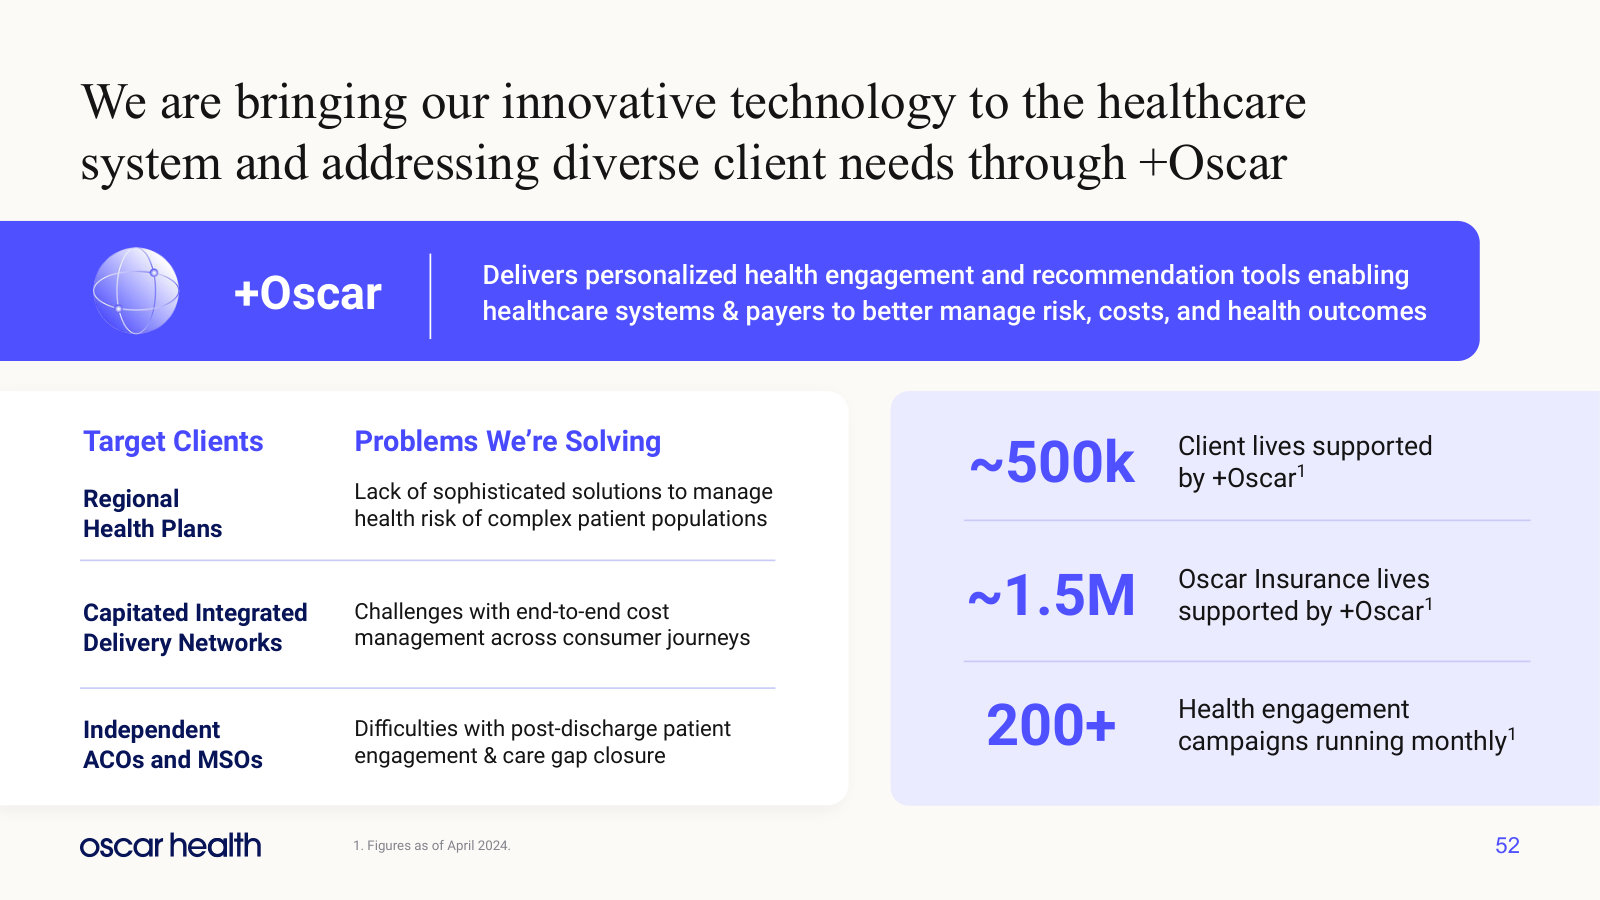
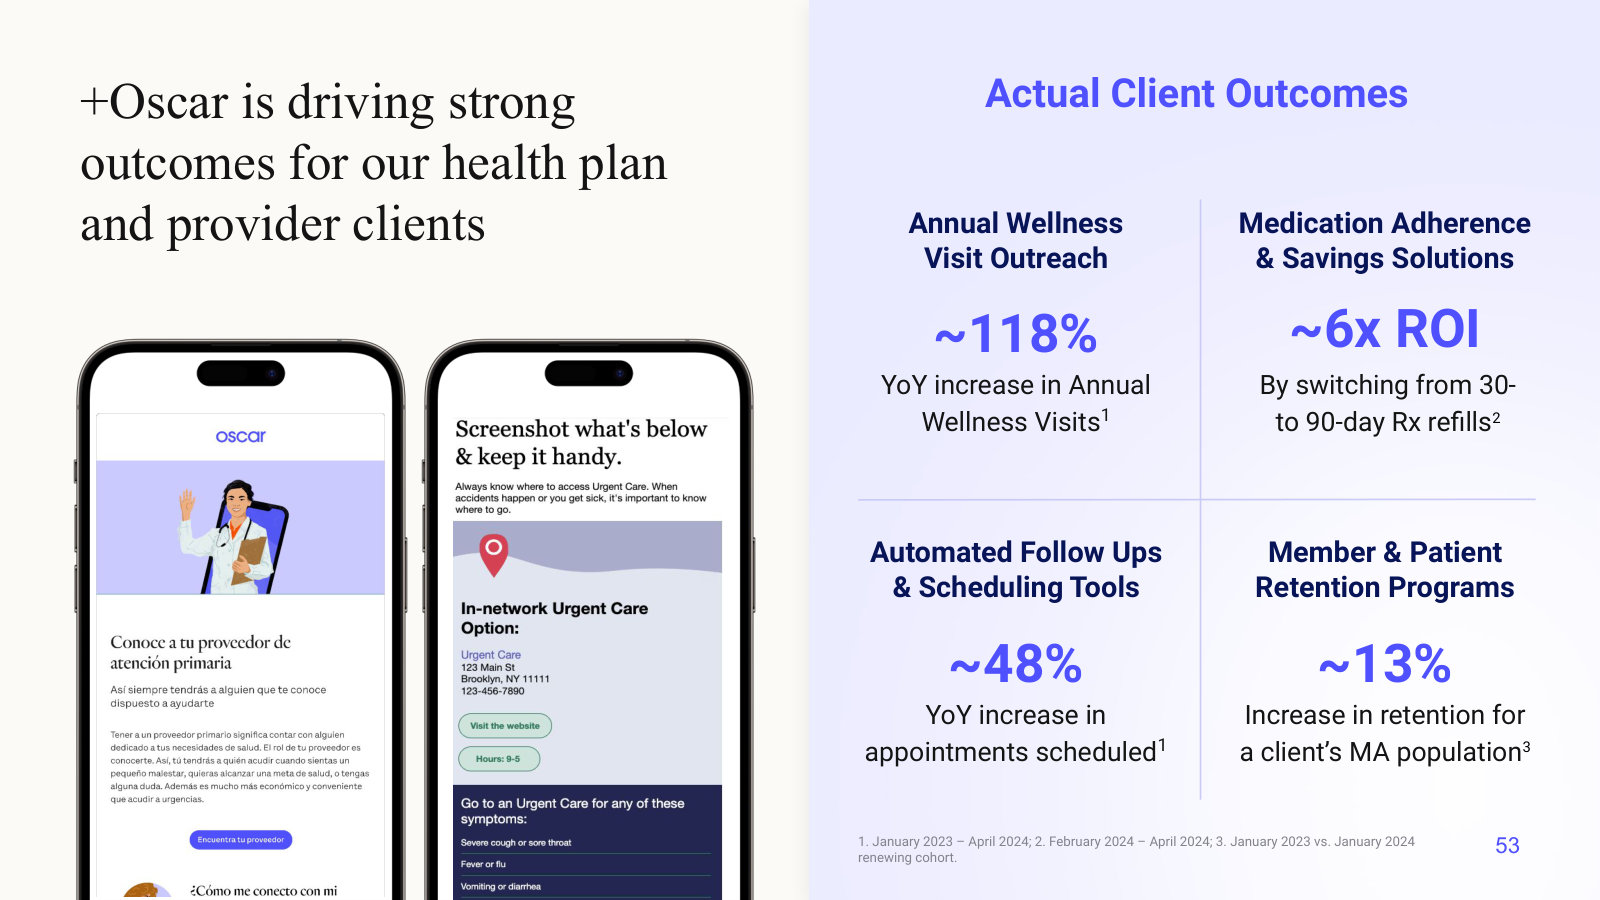
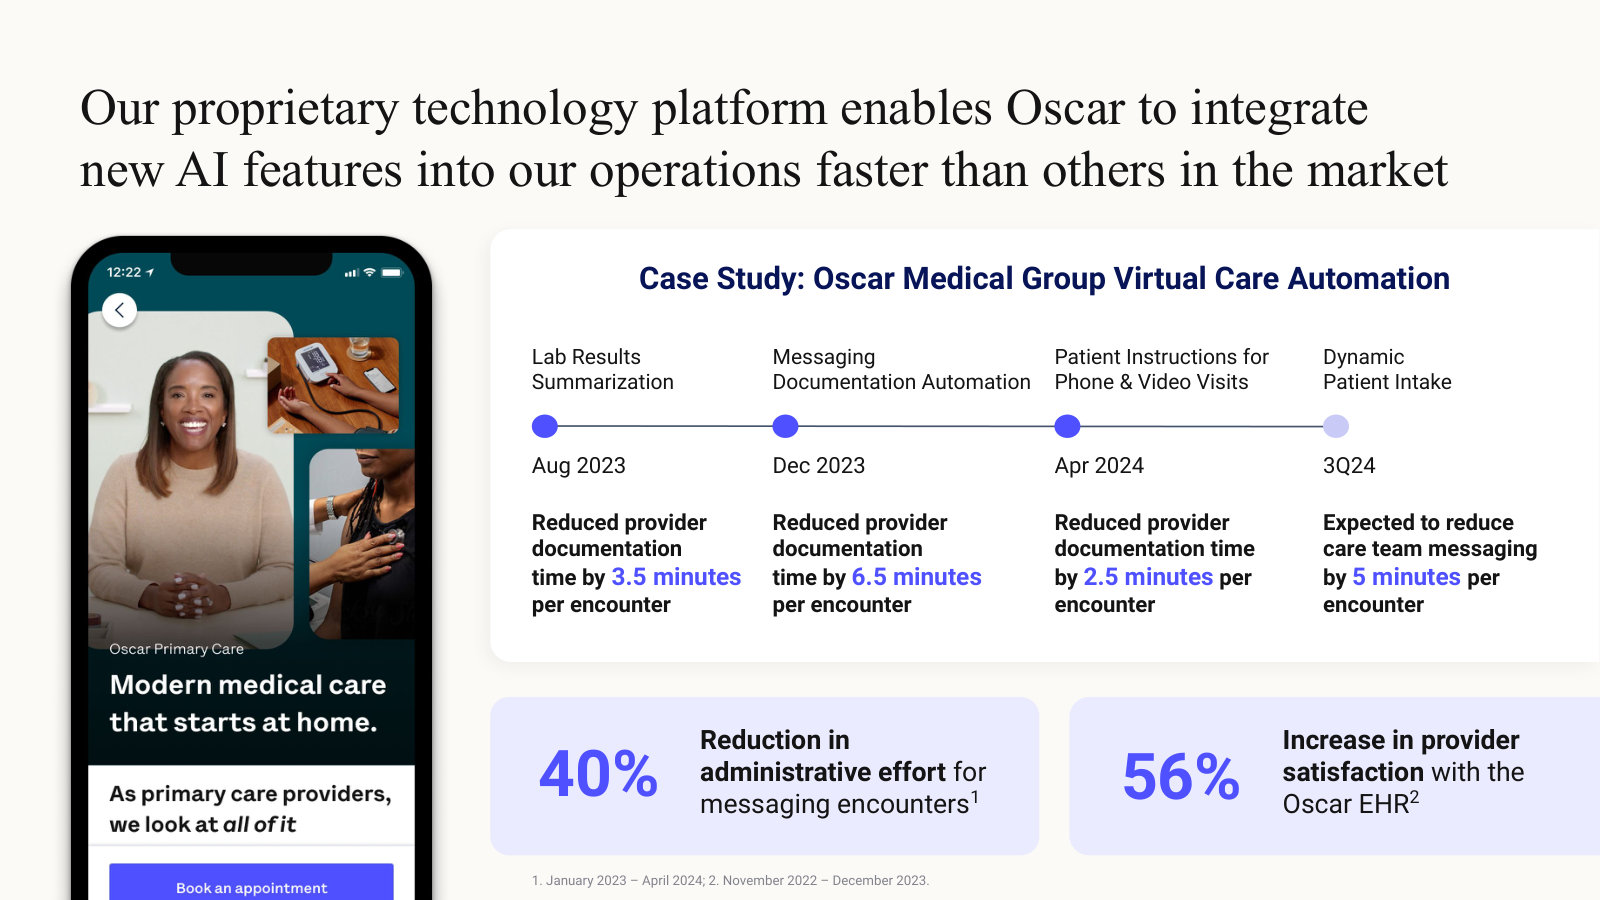
p. 8 — Scorecard against the 2022 investor day commitments — profitability, ACA footprint, and lives on the external platform. · Open the full presentation →p. 9 — The three market forces the case rests on: cost pressure on employer plans, ACA growth, and new healthcare technology. · Open the full presentation →p. 10 — The business in one diagram — Oscar Insurance, +Oscar and ICHRA on a shared technology platform, each with its market size. · Open the full presentation →p. 12 — The four strategic objectives that organize the rest of the deck. · Open the full presentation →p. 13 — Individual market size from 2021 to 2027, and how much of it depends on enhanced subsidies being extended. · Open the full presentation →p. 15 — What enhanced subsidies do to an enrollee's monthly premium by income band — the core policy risk, quantified. · Open the full presentation →p. 17 — The financial frame: ~20% revenue CAGR to 2027, ~5% operating margin, and the four moves meant to get there. · Open the full presentation →p. 19 — The member-provider flywheel with the engagement numbers behind the retention argument: 66 NPS, 82% retention. · Open the full presentation →p. 21 — The case for selling the platform to other payors — ~80% of health plans outsource core operations, ~$25B of spend. · Open the full presentation →p. 23 — ICHRA sizing: ~21M traditional ACA lives against ~75M lives sitting in small and mid-size employer plans. · Open the full presentation →p. 24 — What ICHRA actually is, and how it differs from traditional group coverage for the employer and the employee. · Open the full presentation →p. 26 — The ICHRA platform ecosystem Oscar partners with, and the routes those partners use to reach employers. · Open the full presentation →p. 30 — The track record through 2024: 542k members to ~1.5M, and adjusted EBITDA from ($430M) to guided positive. · Open the full presentation →p. 31 — The 2027 targets — ~20% revenue CAGR, ~5% operating margin, $2.25+ EPS — this management is measured against. · Open the full presentation →p. 32 — Revenue bridge to 2027, including the (5)-(7)% hit management assumed from enhanced subsidy expiration. · Open the full presentation →p. 33 — Margin bridge to ~5%: medical trend set against pricing, operating leverage and tech-enabled efficiency. · Open the full presentation →p. 34 — MLR history and the ~80% target, with the levers beside it — pricing discipline, total cost of care, scale. · Open the full presentation →p. 35 — SG&A ratio split into fixed and variable, and the path from 24.3% down to a ~16% target. · Open the full presentation →p. 36 — How capital works here: insurance subsidiary capital plus parent cash, and what management intends to do with it. · Open the full presentation →p. 39 — Oscar Insurance at a glance in 2024 — ~1.5M members, ~7% ACA share, 18 states. · Open the full presentation →p. 41 — Revenue growth by years since market entry for Miami, Iowa and Atlanta — the maturation curve they underwrite to. · Open the full presentation →p. 42 — In-market opportunity: 10M lives in the 2024 footprint, 16M by 2027 on expansion, 4M more if subsidies extend. · Open the full presentation →p. 43 — Where 2027 membership comes from — maturing existing markets from ~13% to ~18% share, plus new markets and products. · Open the full presentation →p. 44 — The product line-up mapped to the member problems it targets: HolaOscar, diabetes plans, $0-deductible designs. · Open the full presentation →p. 45 — The three total-cost-of-care levers and the cumulative savings management attributes to them. · Open the full presentation →p. 46 — Oscar's normalized claim trend against medical CPI since 2018 — the strongest piece of evidence in the deck. · Open the full presentation →p. 51 — What the technology delivers inside the insurer: 98%+ claims auto-adjudication, care routing, member engagement. · Open the full presentation →p. 52 — +Oscar explained — who buys it, what problem it solves, and how many lives sit on the platform. · Open the full presentation →p. 53 — The client outcomes +Oscar sells on: wellness visits, Rx adherence, scheduling and retention. · Open the full presentation →p. 55 — A concrete AI case study — provider documentation time saved per encounter at Oscar Medical Group, release by release. · Open the full presentation →
The earlier investor day, kept for what it explains and nothing since has: the P&L mechanics, the technology stack and +Oscar. · Open the full document →
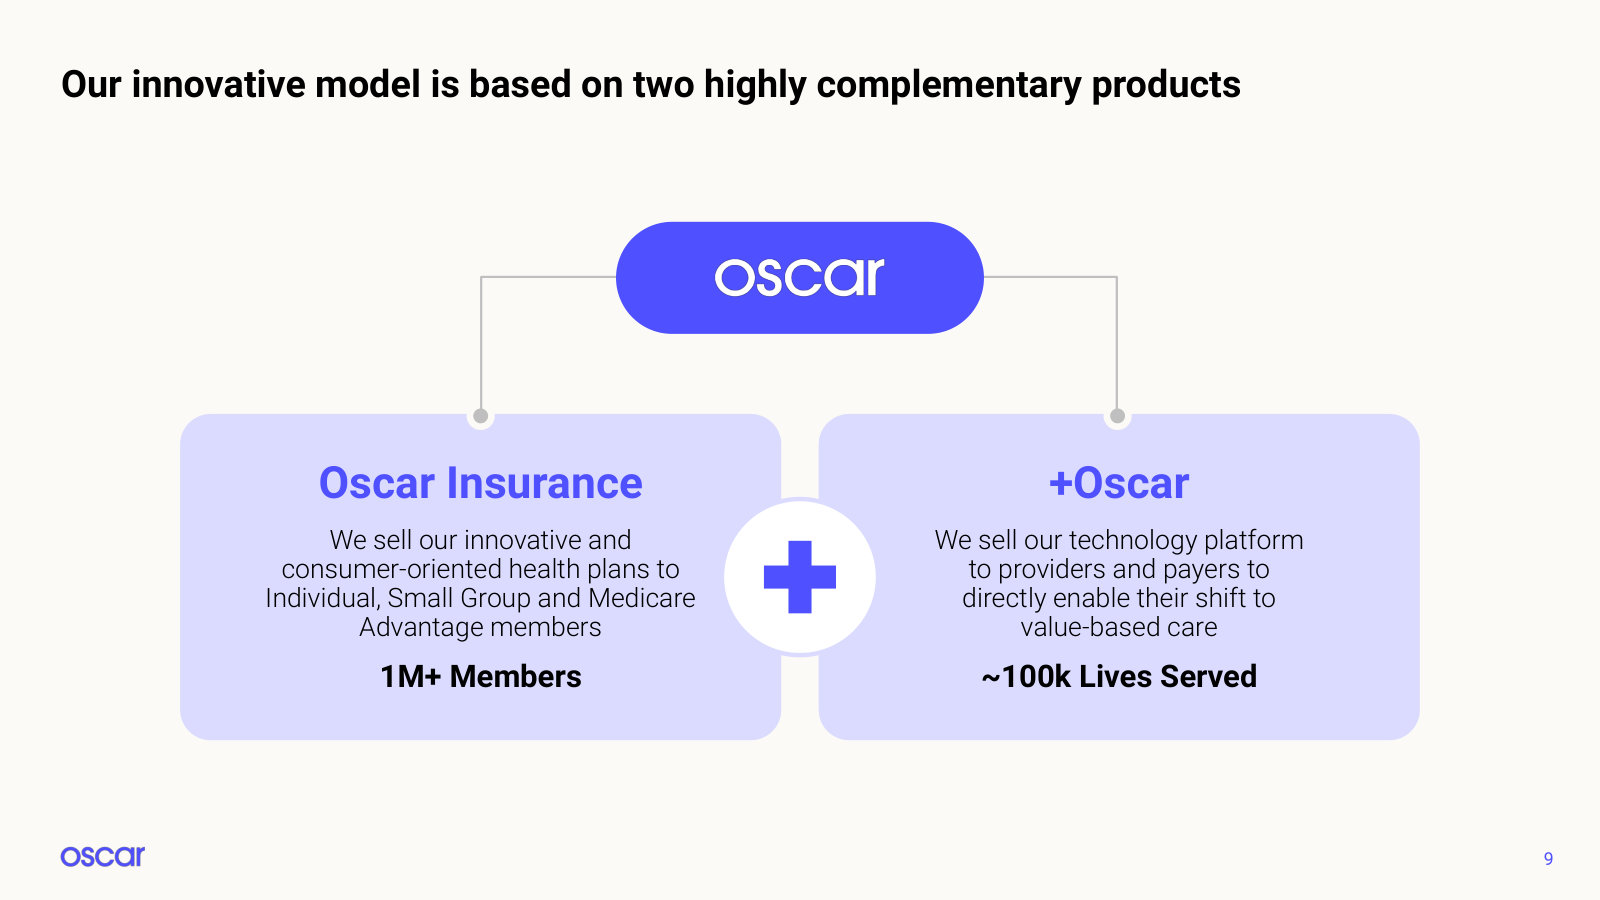
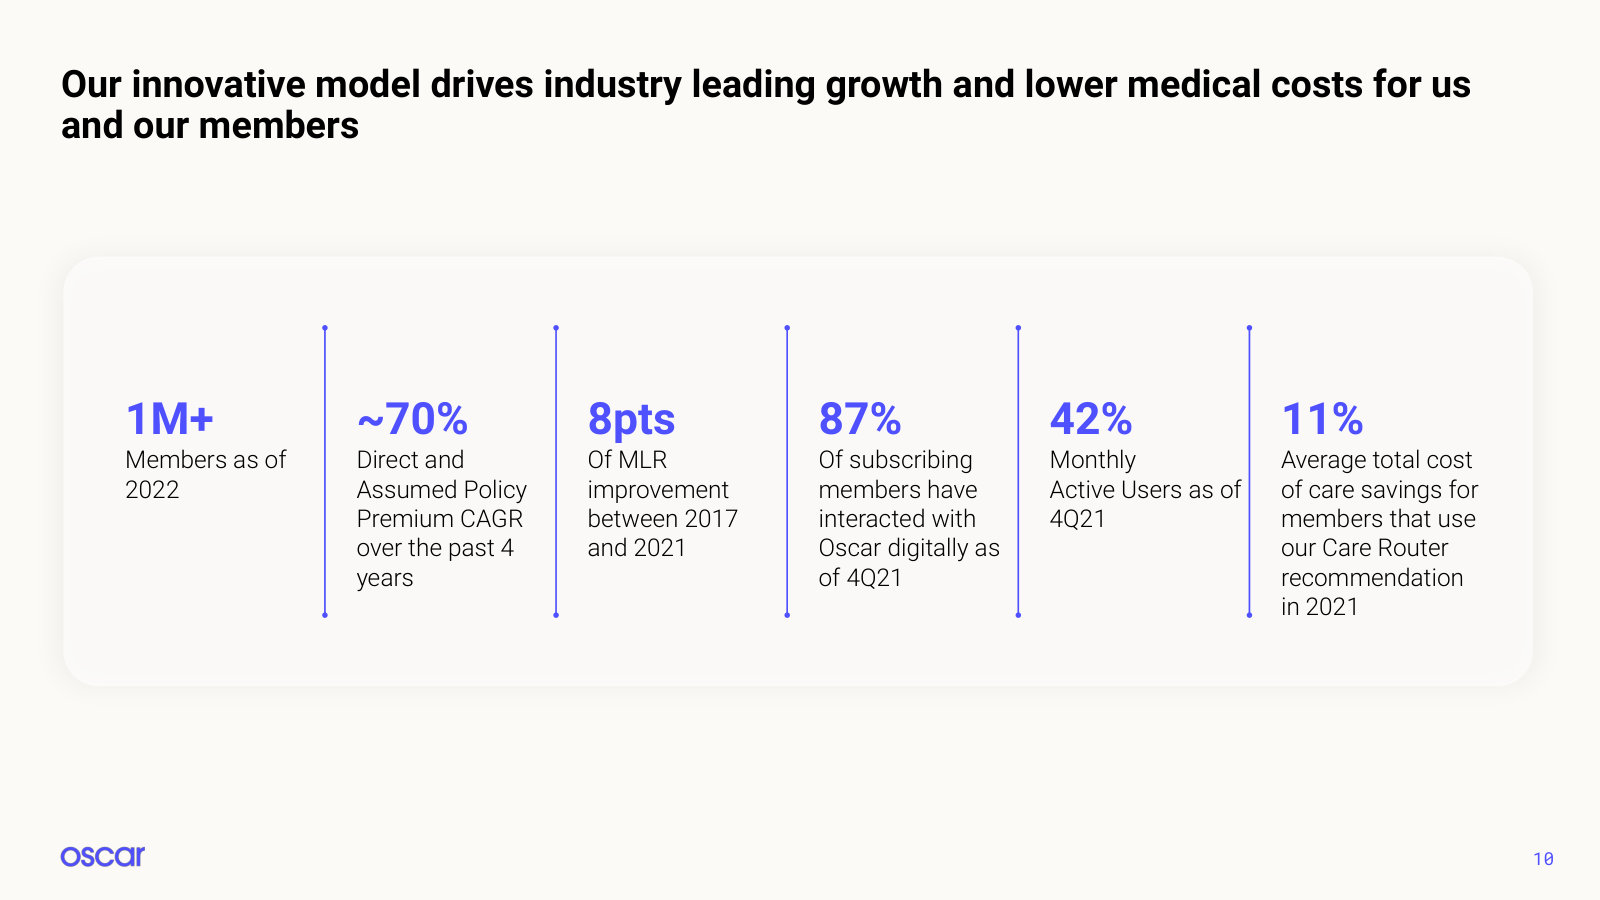
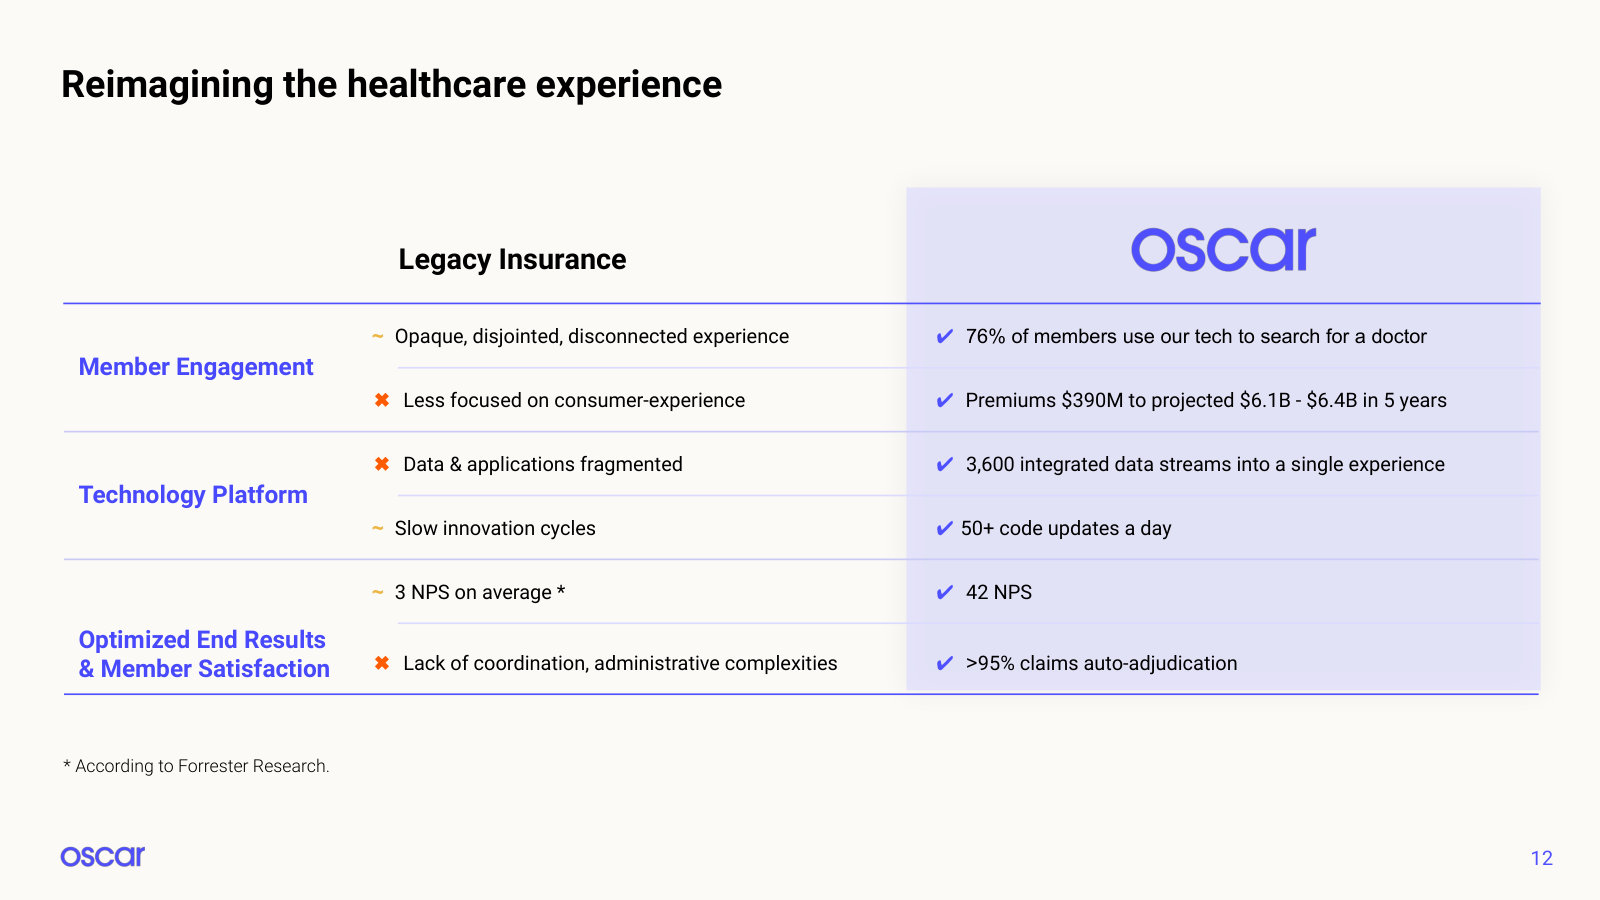
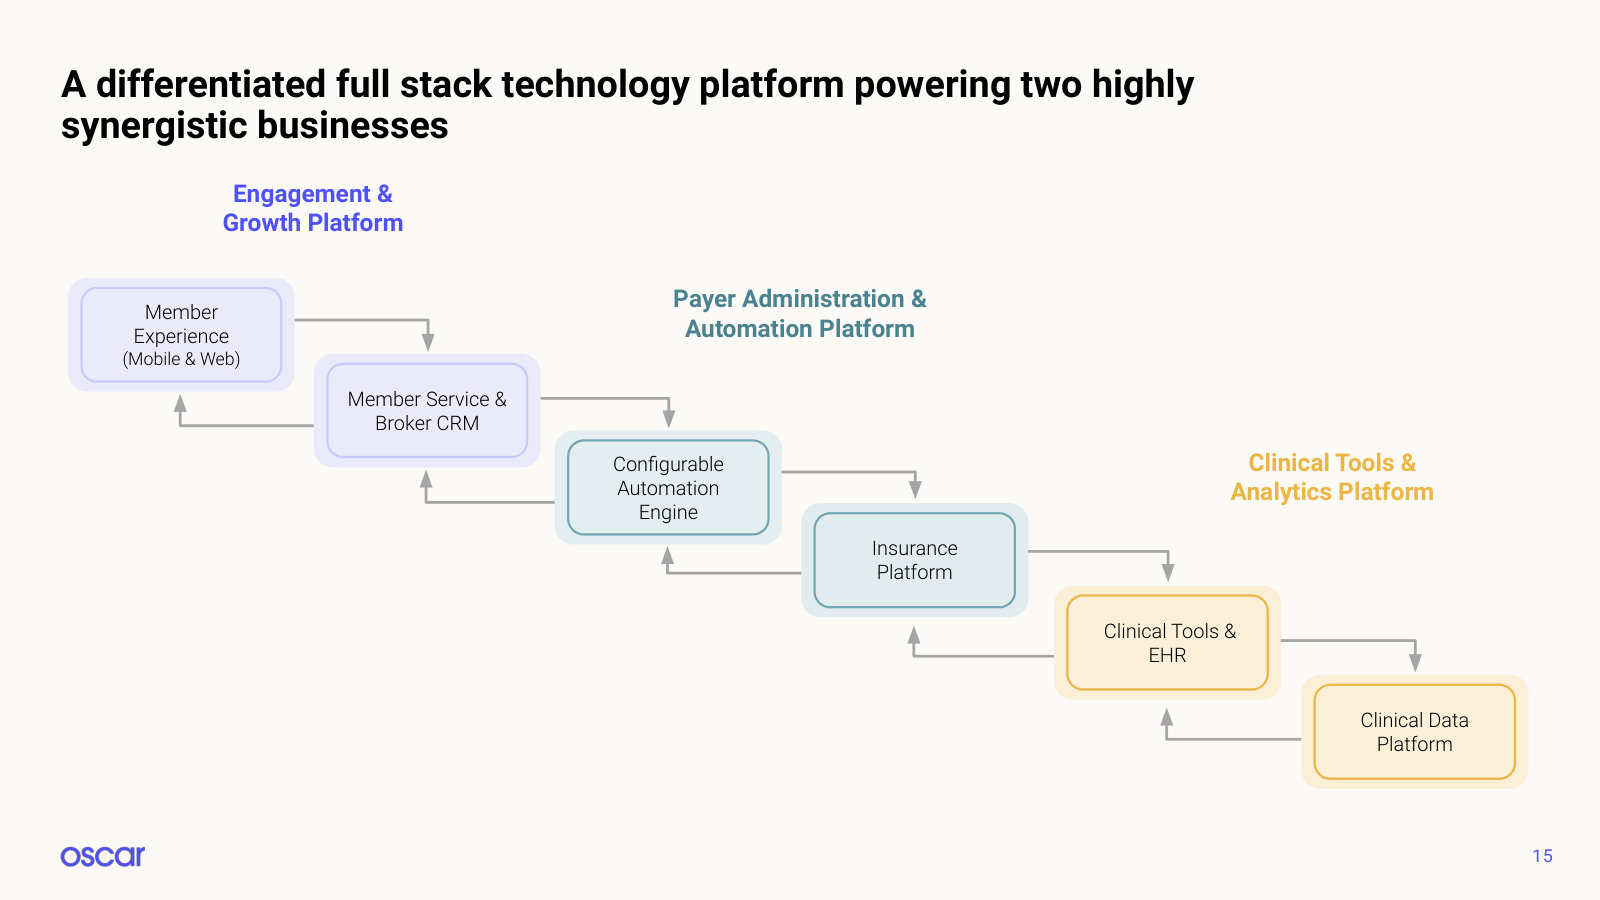
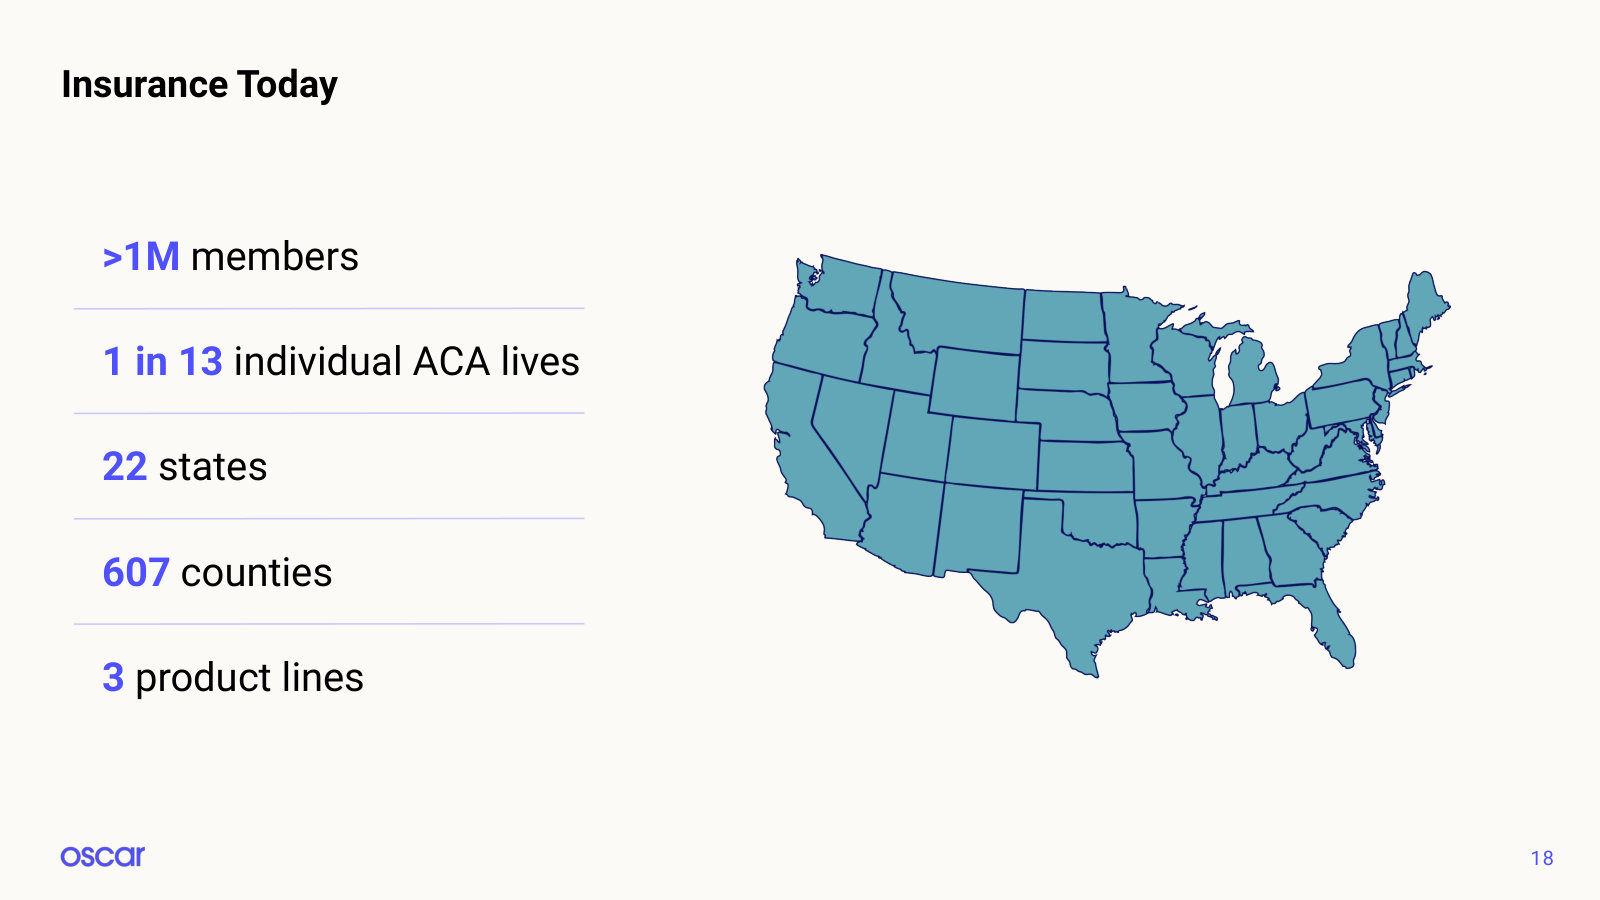
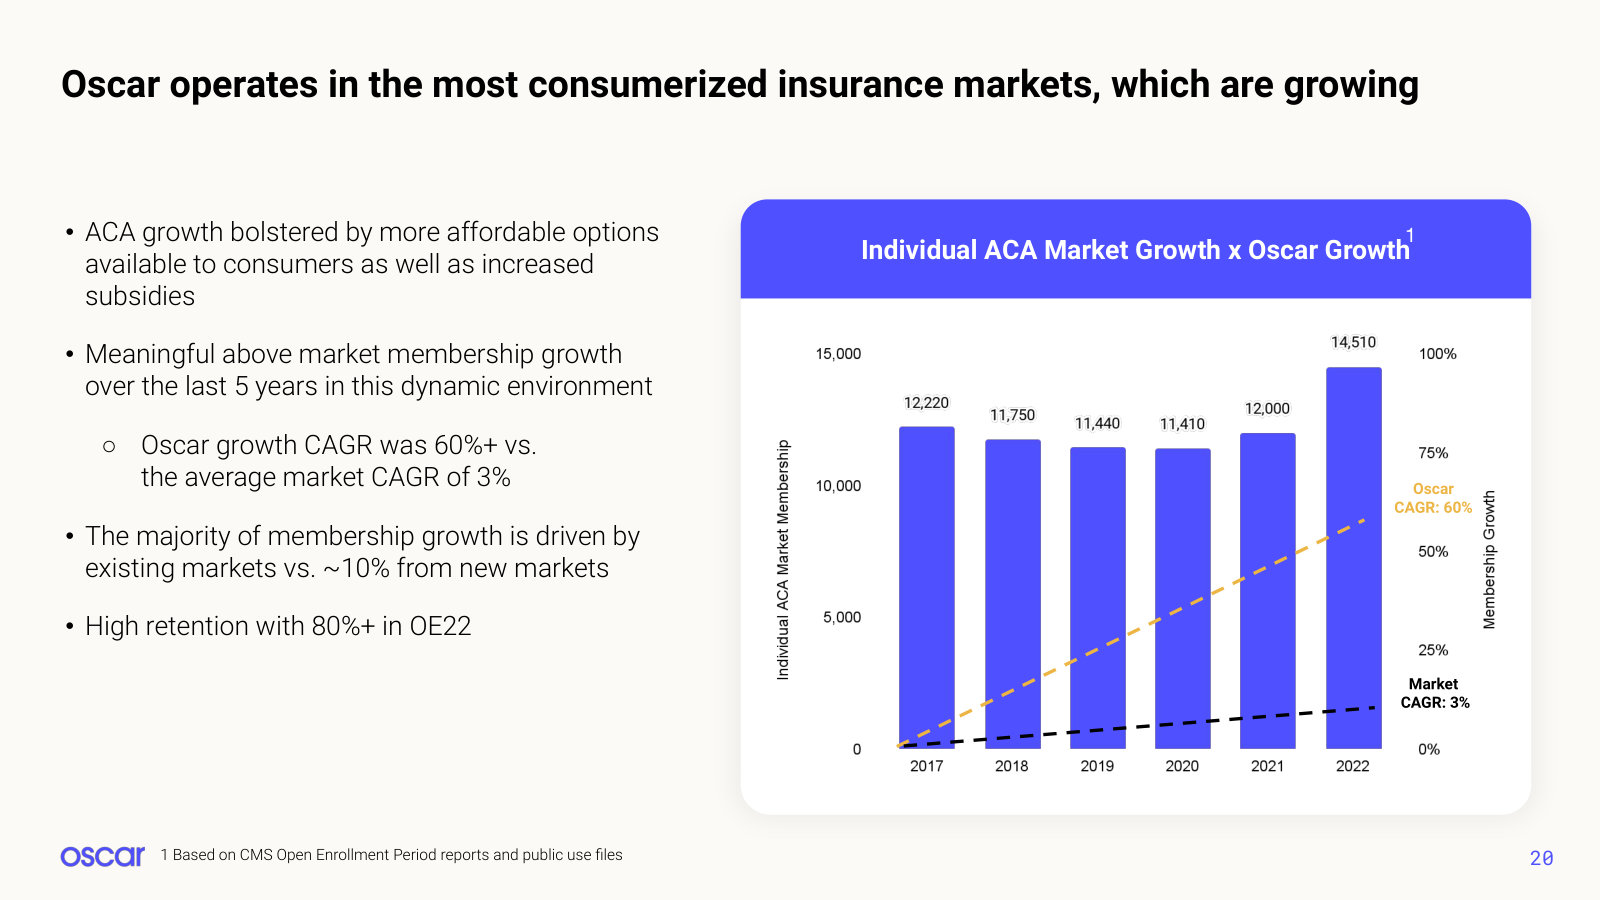
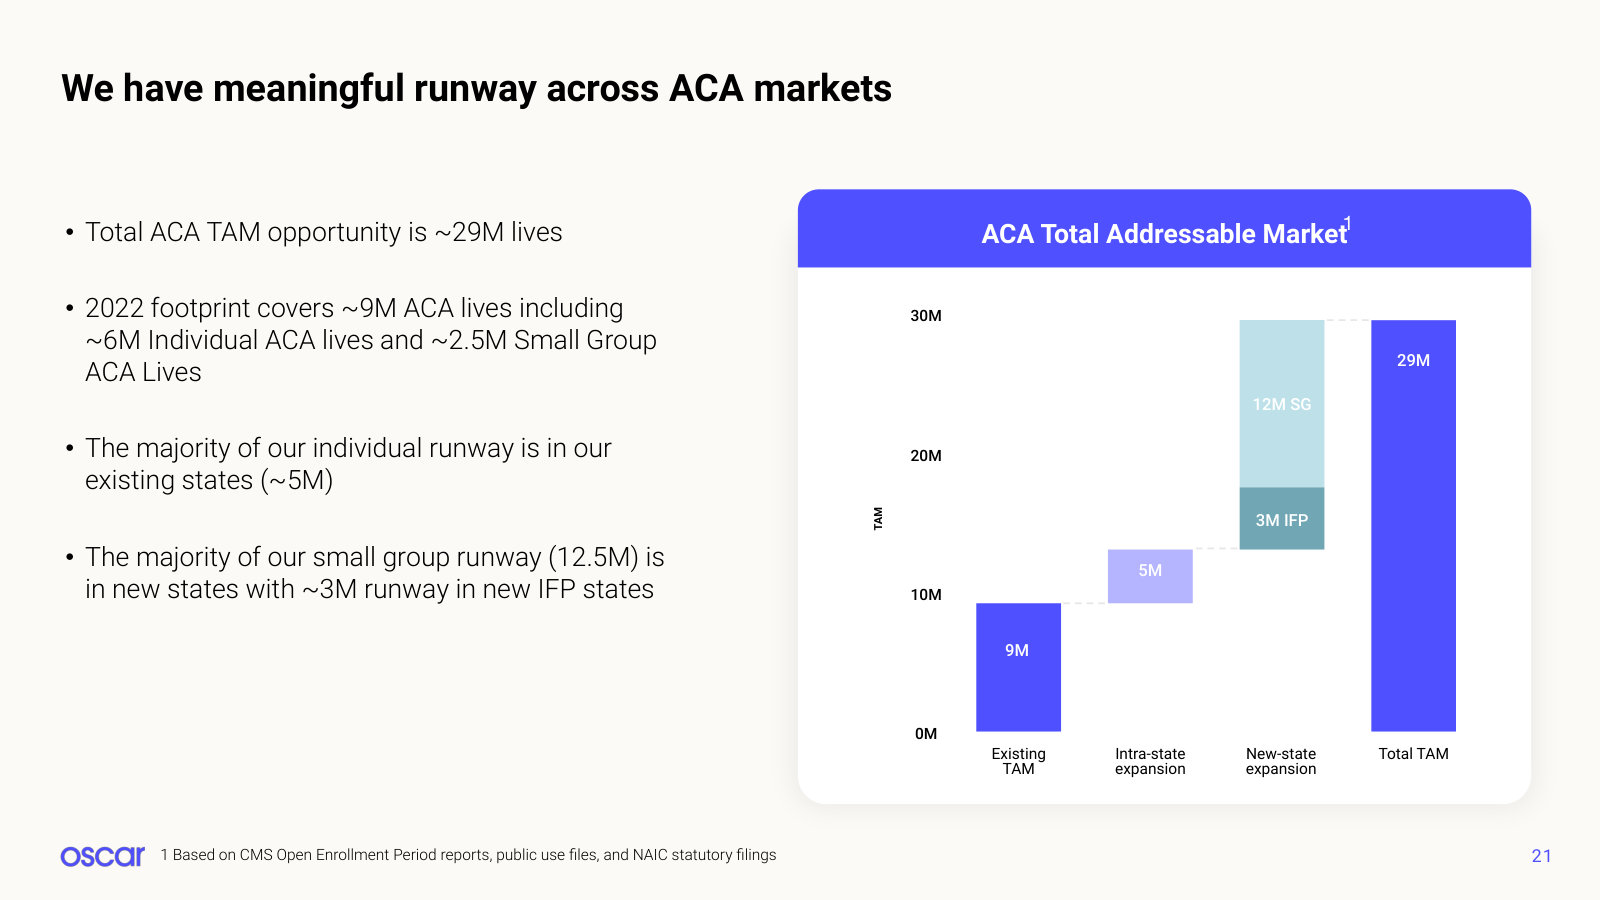
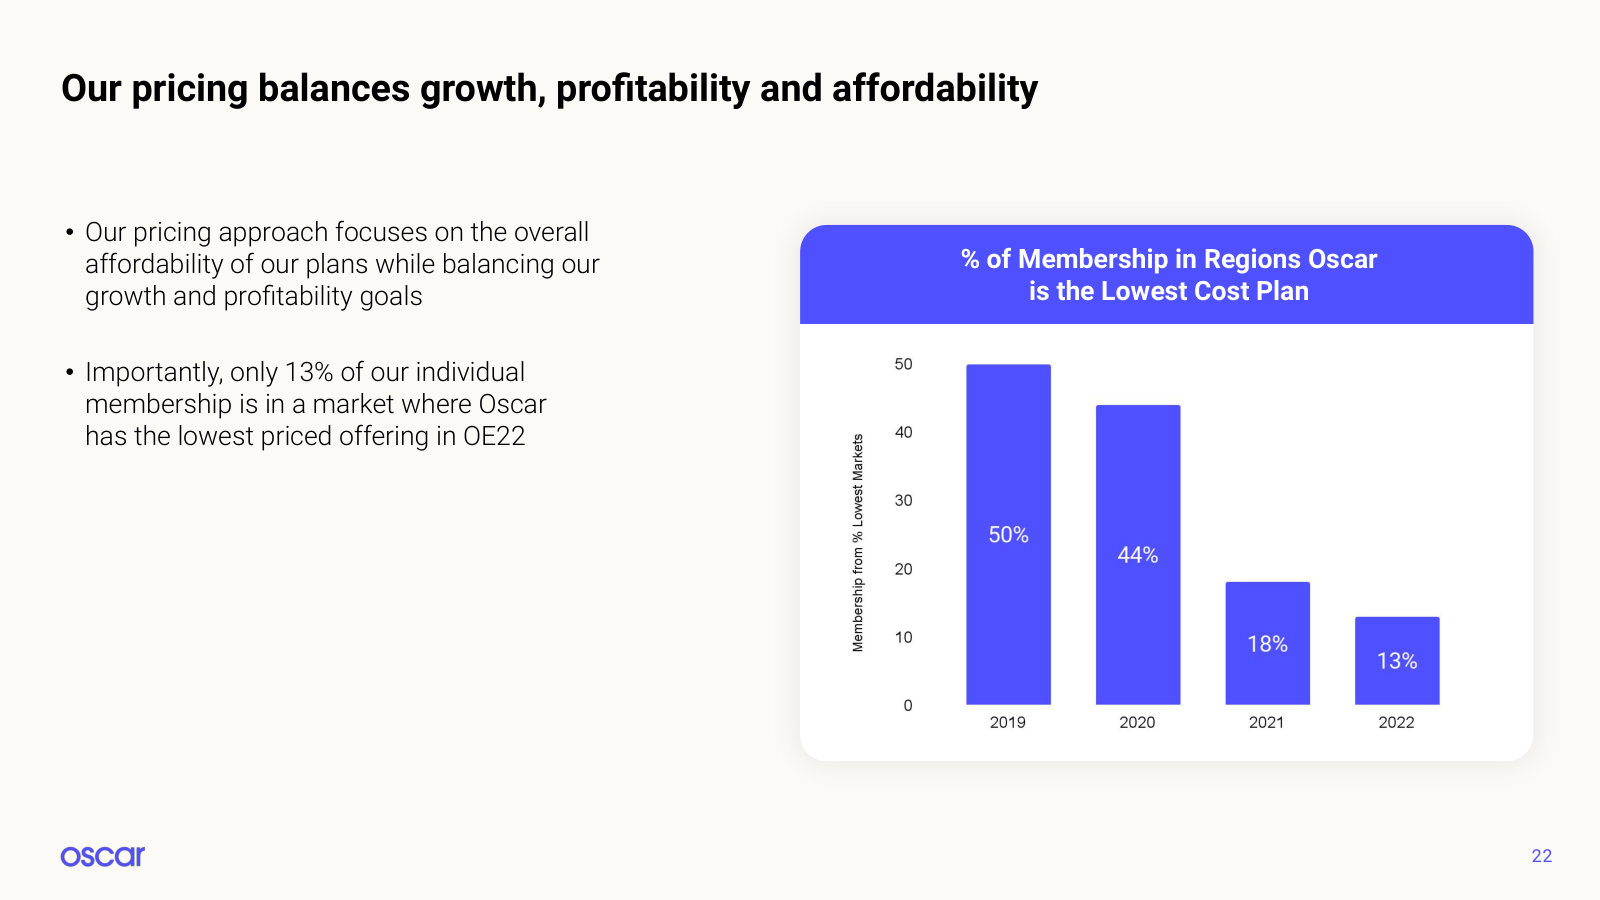
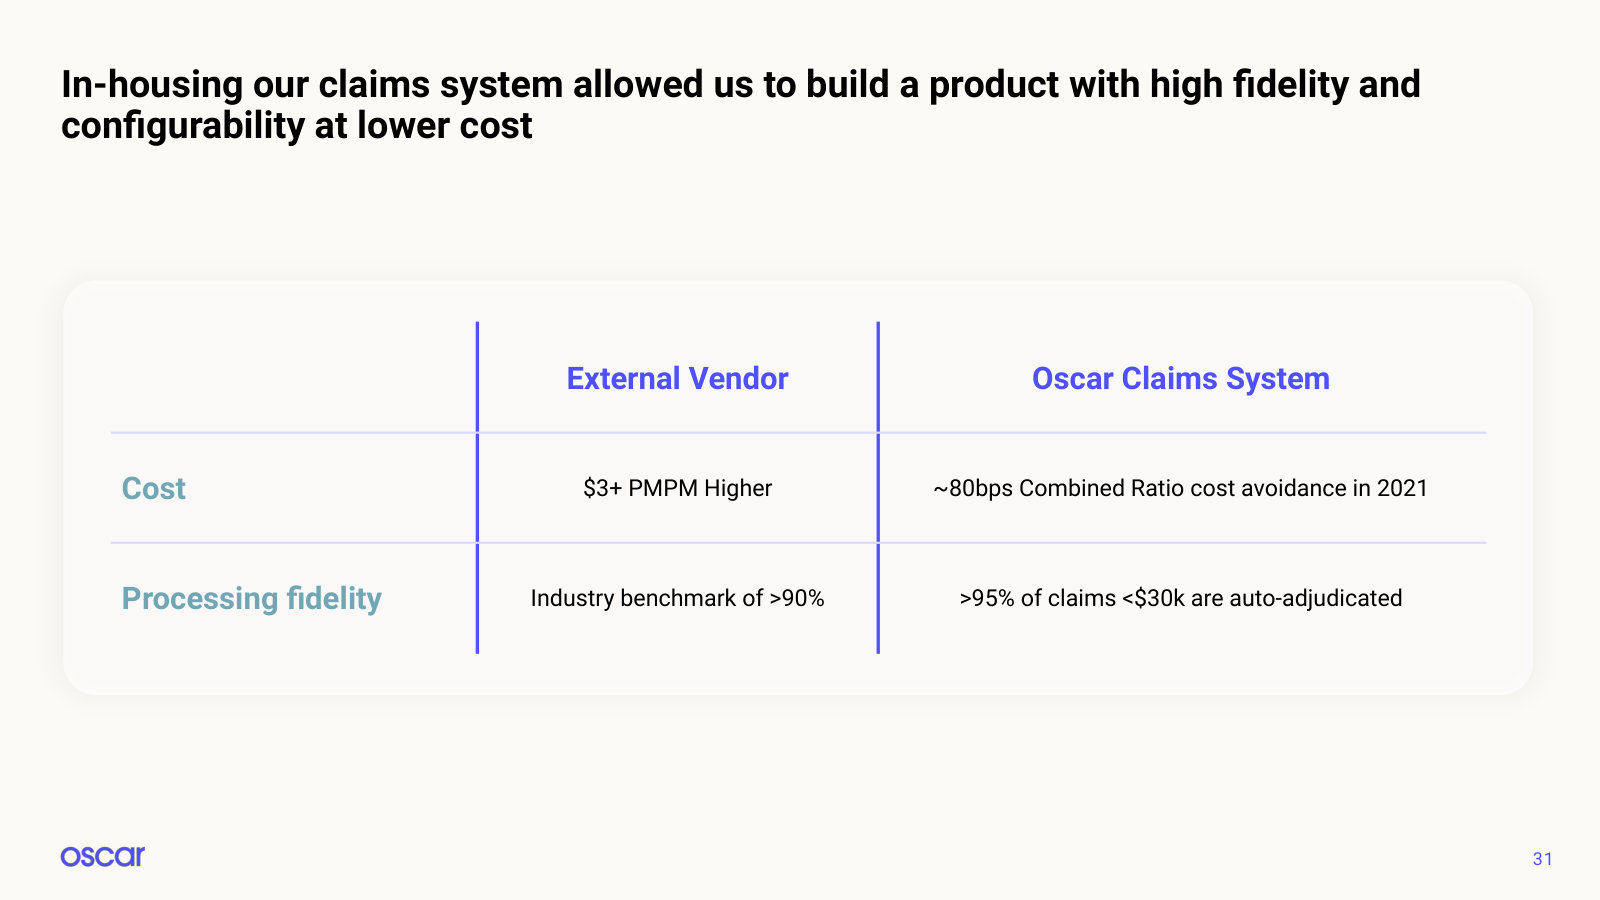
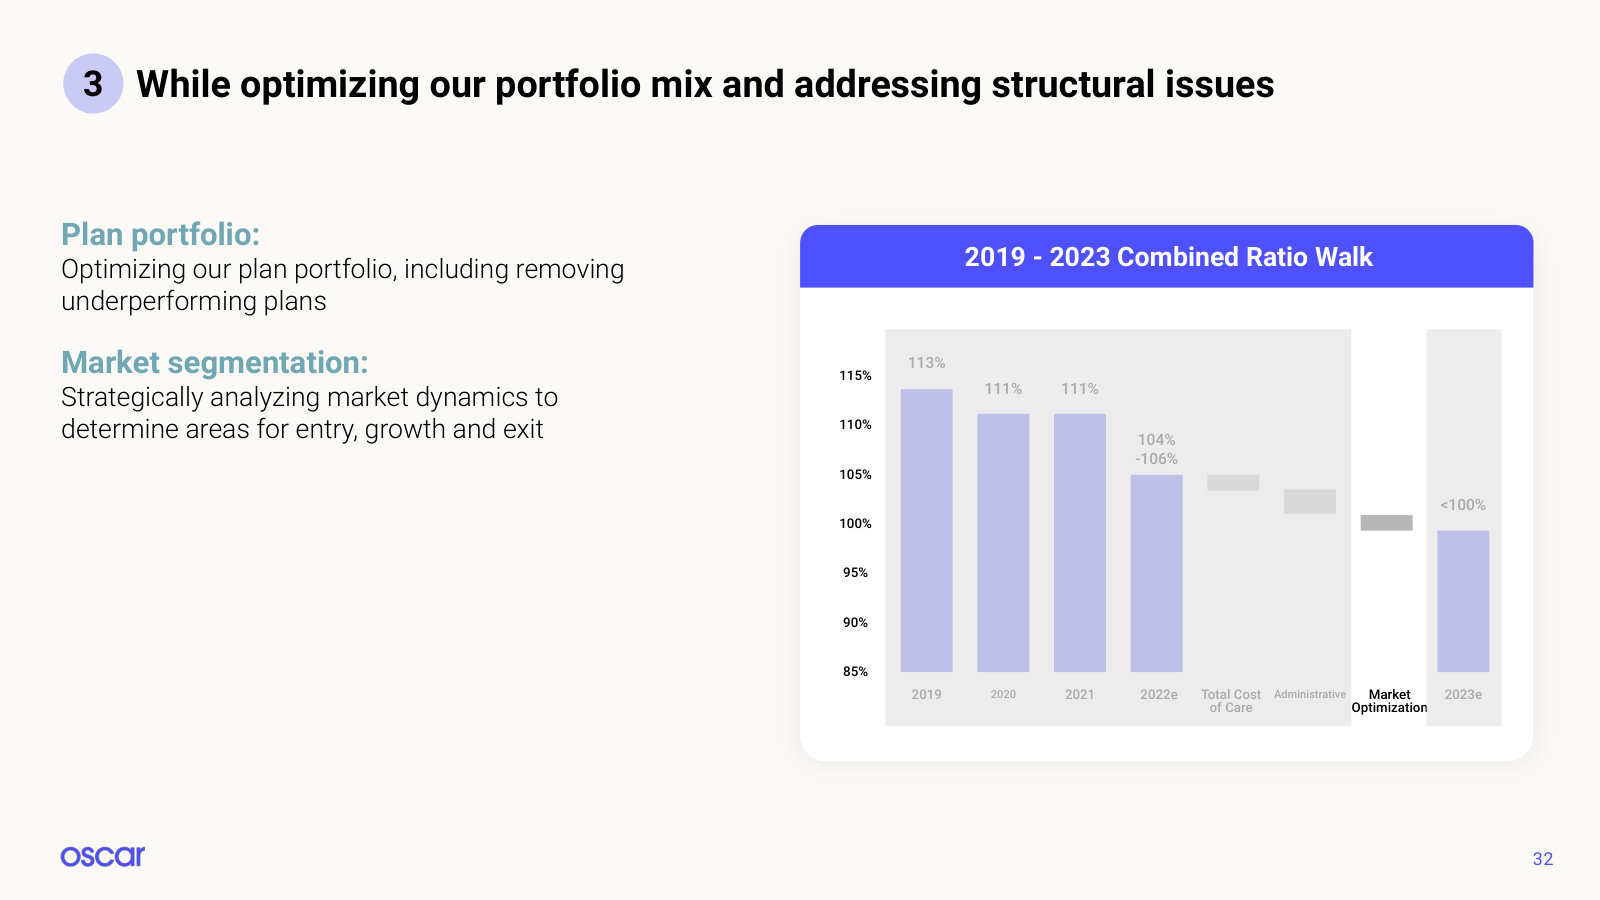
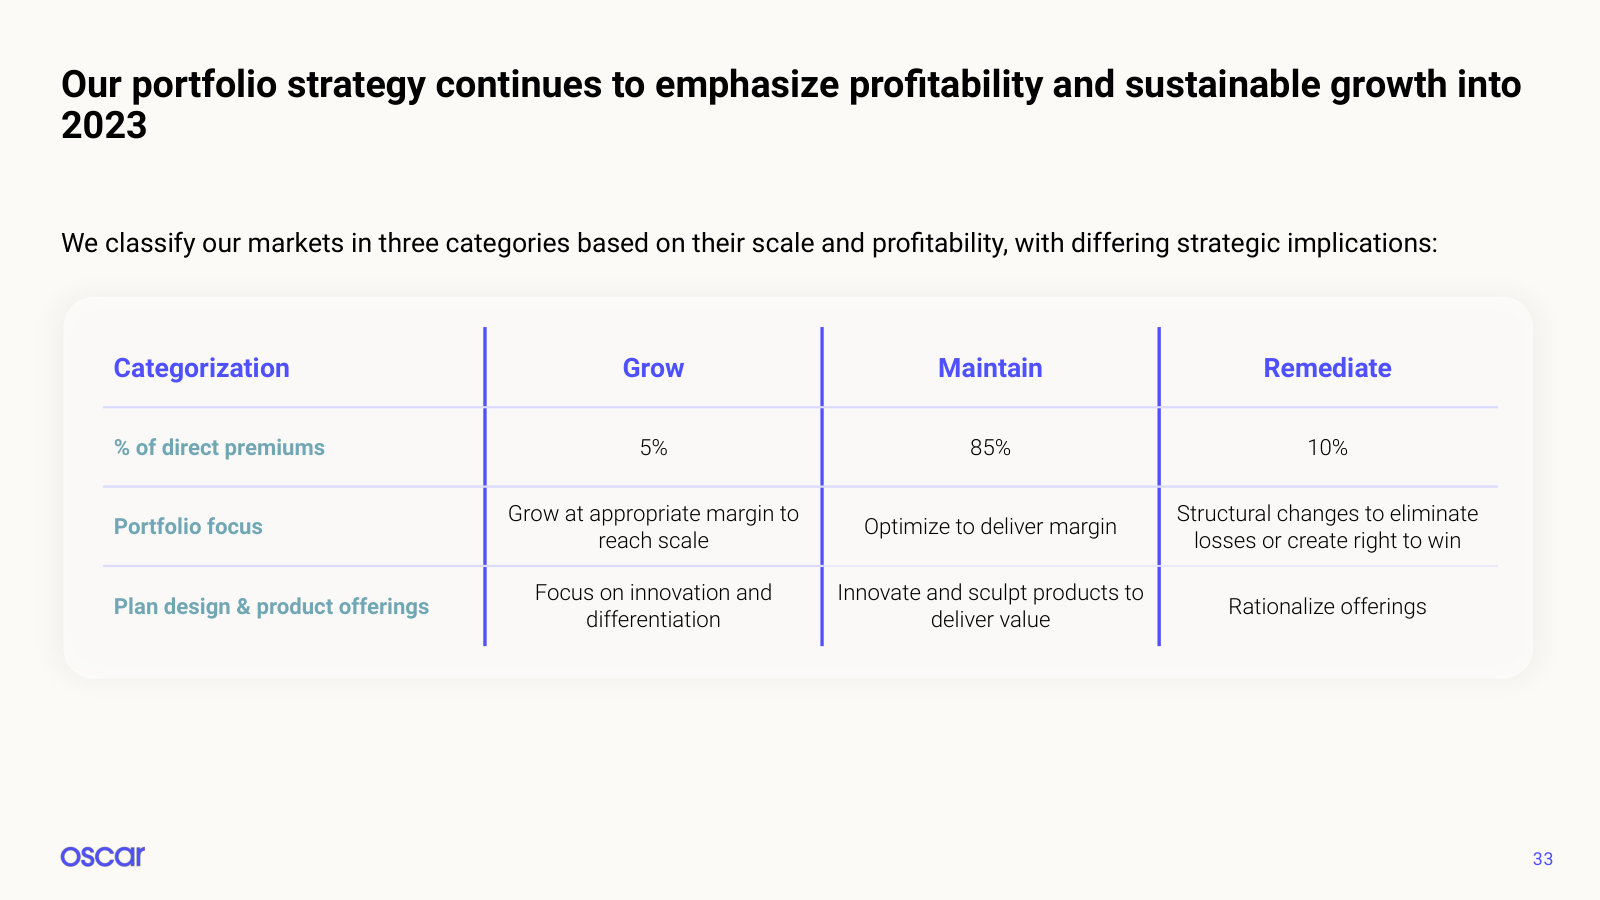
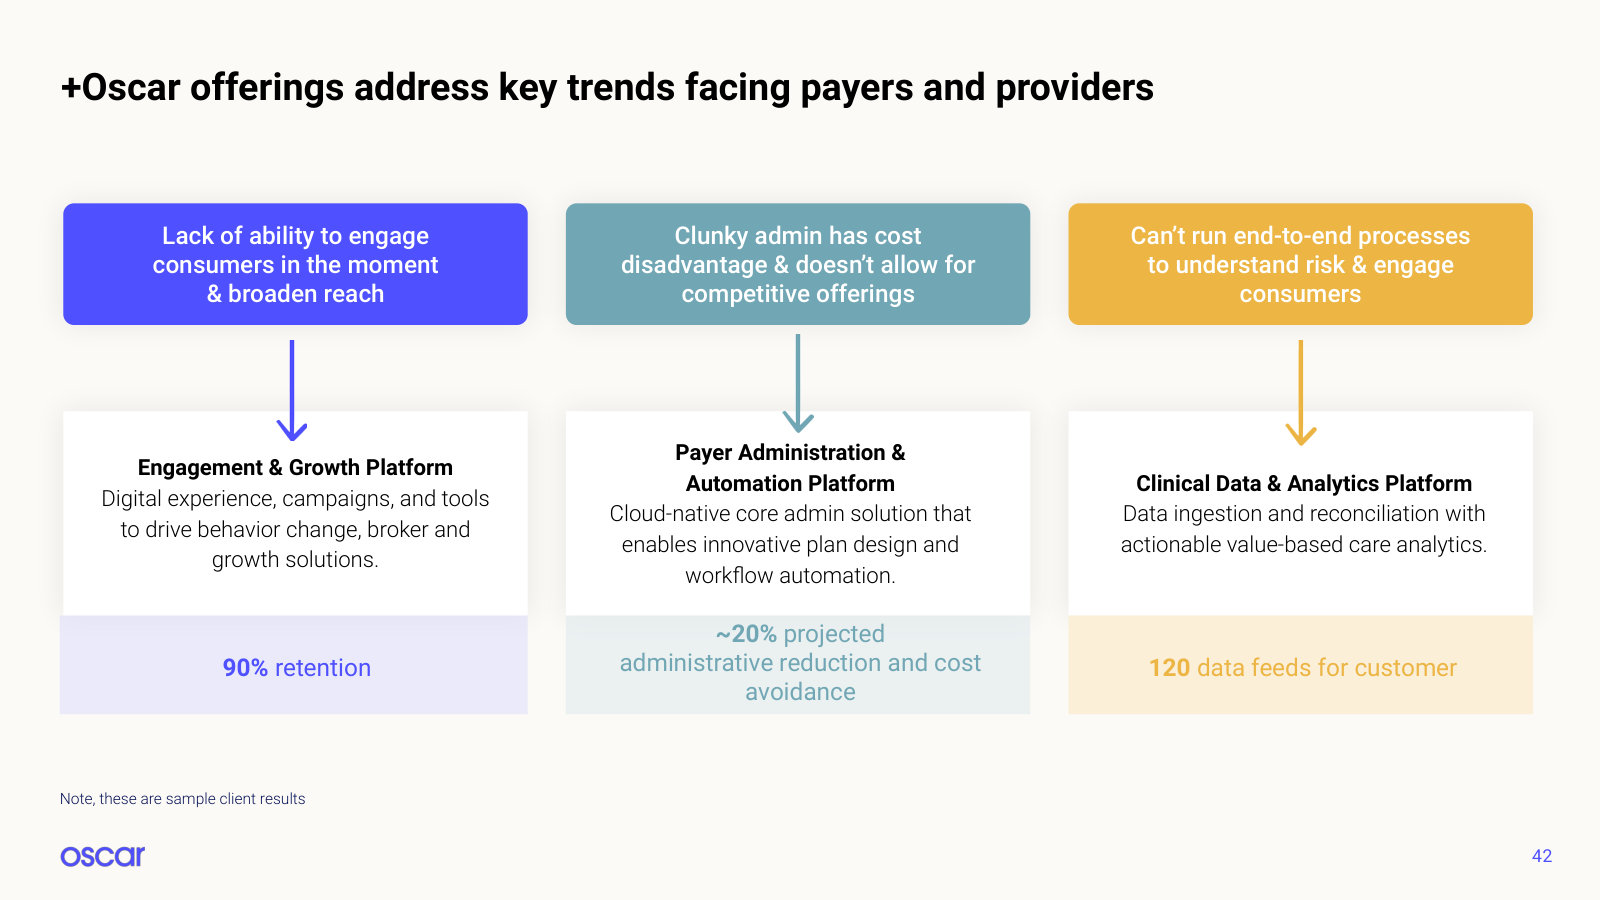
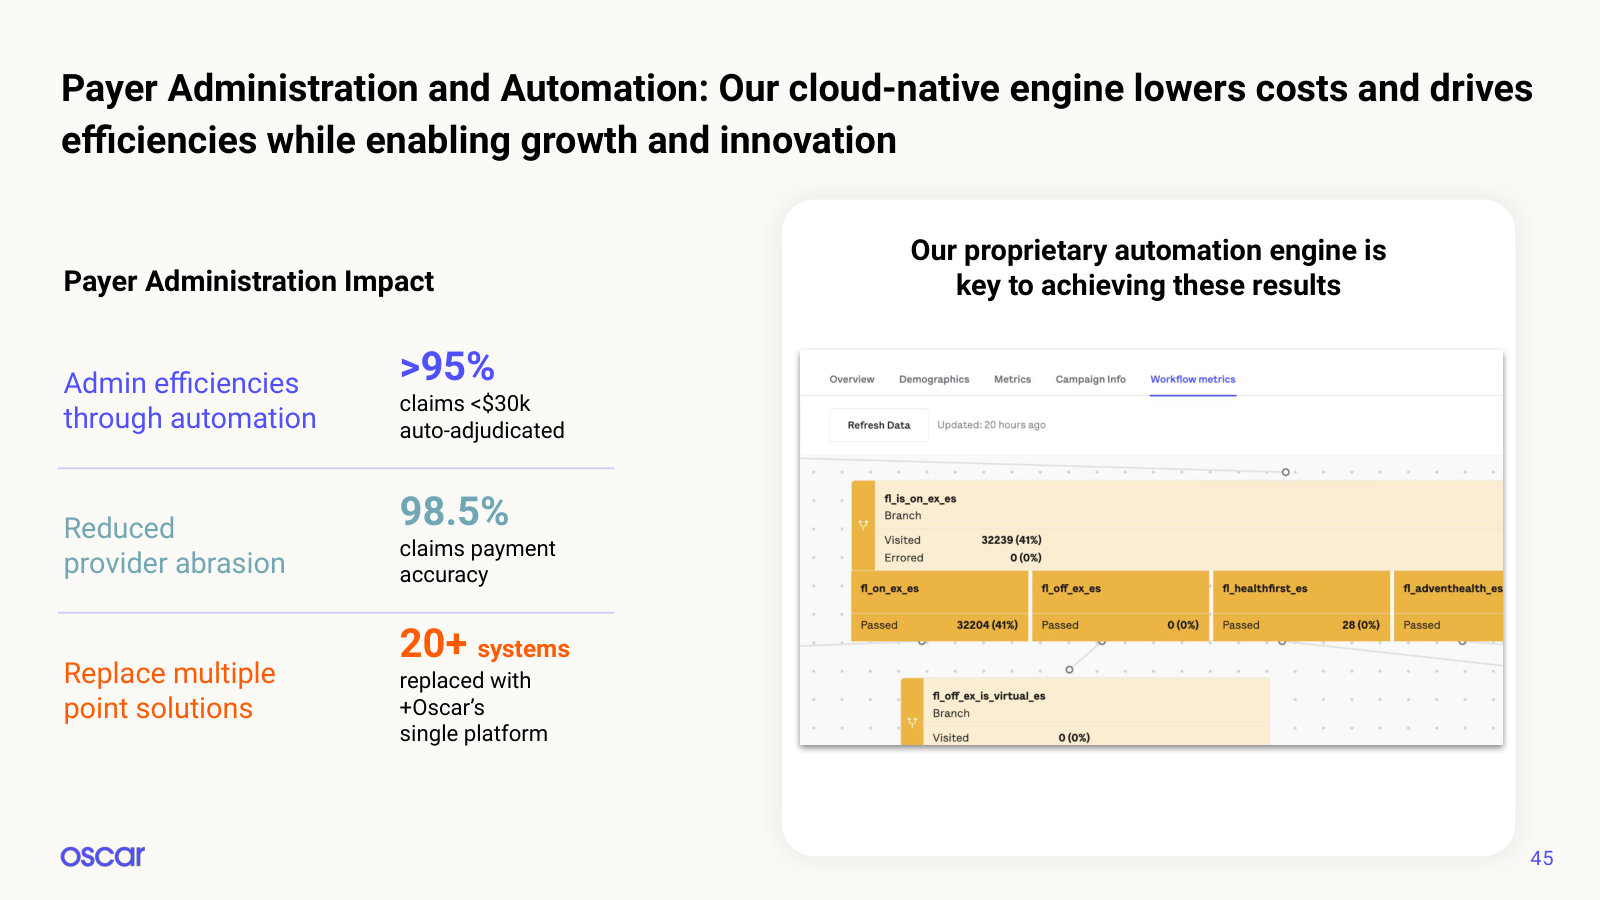
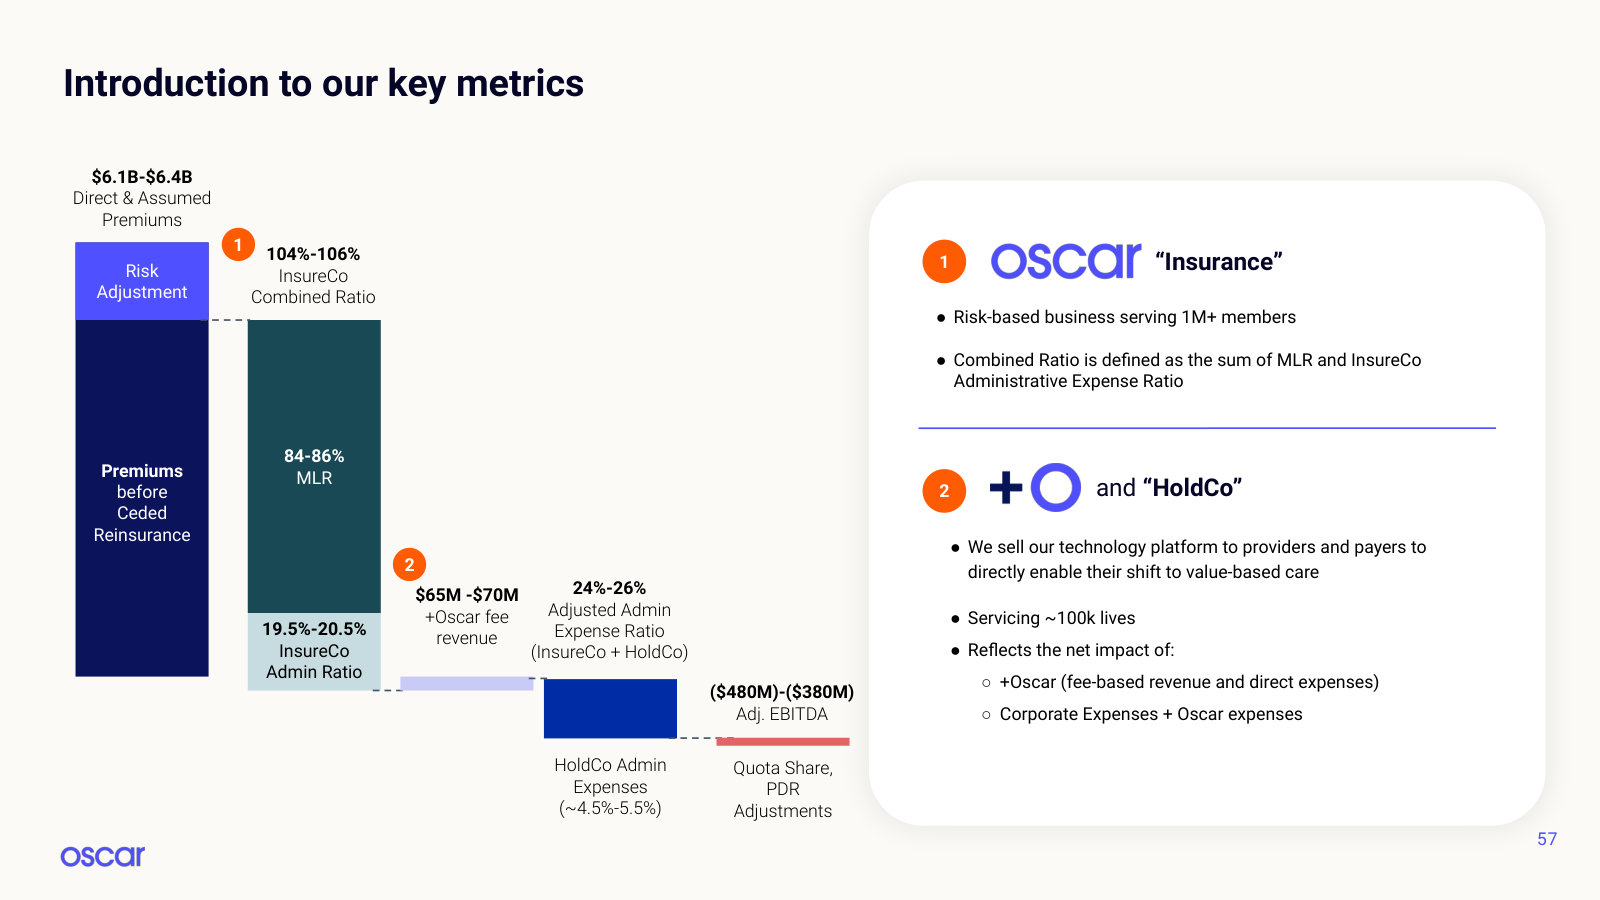
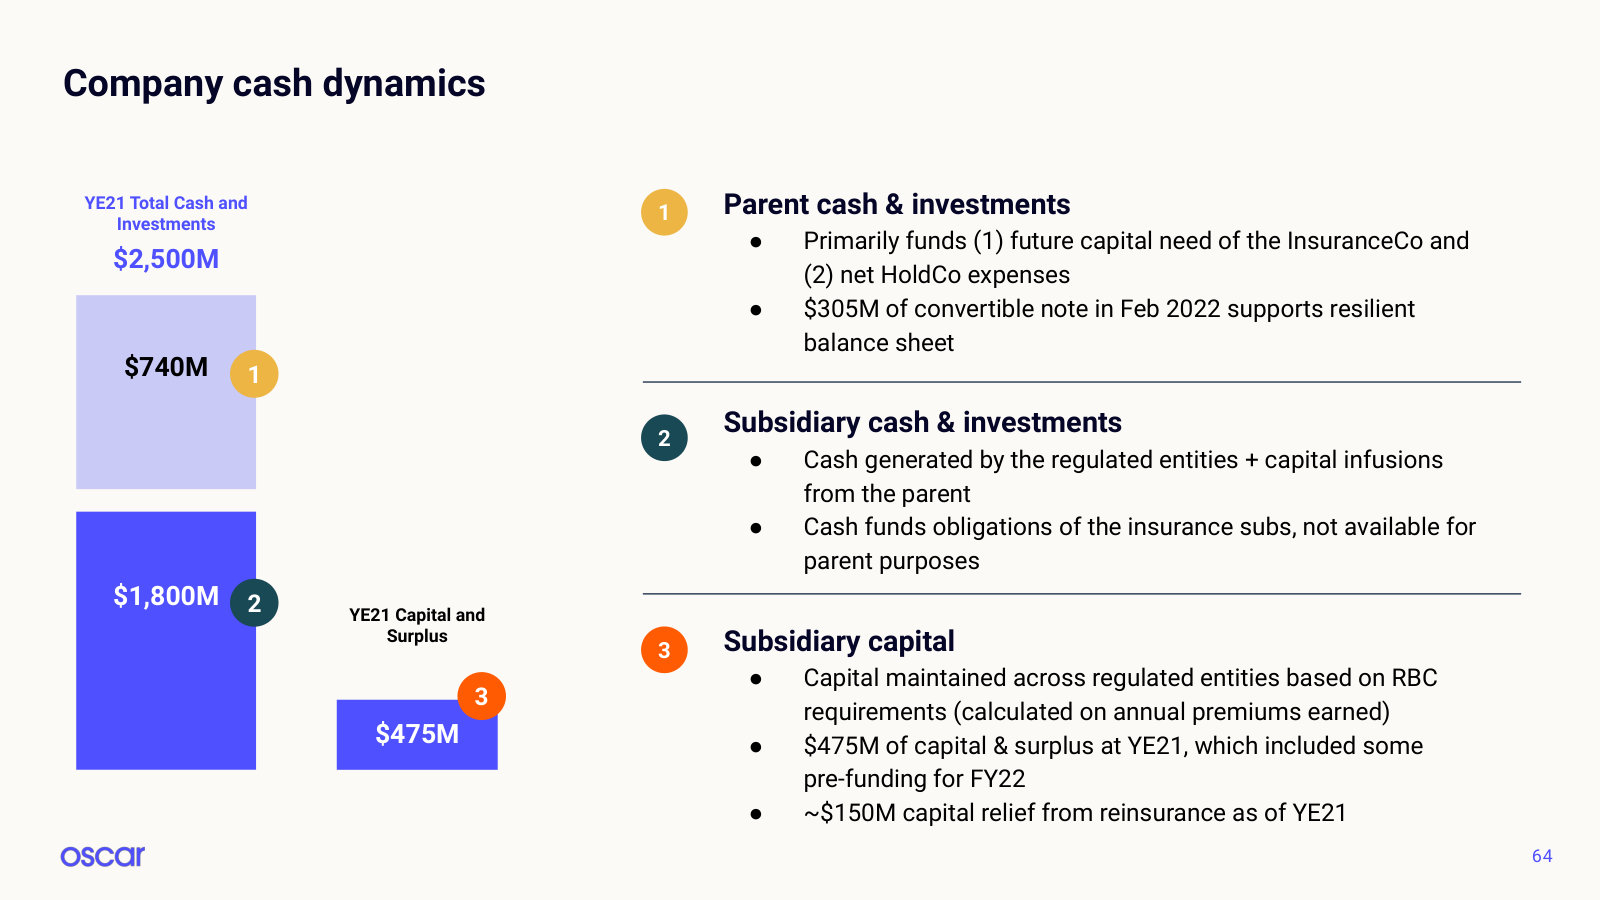
p. 9 — The two-product model as management framed it in 2022: Oscar Insurance plus the +Oscar platform business. · Open the full presentation →p. 10 — The 2022 scorecard — 1M+ members, ~70% four-year premium CAGR, 8 points of MLR improvement since 2017. · Open the full presentation →p. 12 — Legacy insurer versus Oscar, line by line, on member engagement, technology and claims handling. · Open the full presentation →p. 15 — The full technology stack module by module, from the member app to the clinical data platform. Not restated since. · Open the full presentation →p. 18 — The 2022 footprint: 22 states, 607 counties, three product lines, 1 in 13 individual ACA lives. · Open the full presentation →p. 20 — Oscar's membership growth set against the individual ACA market's — 60% CAGR versus 3%. · Open the full presentation →p. 21 — ACA addressable market split into existing footprint, intra-state expansion and new-state expansion. · Open the full presentation →p. 22 — How often Oscar is the cheapest plan in its markets, 2019 to 2022 — the shift away from price-led growth. · Open the full presentation →p. 31 — The economics of building the claims system in-house rather than renting one: ~80bps of combined ratio. · Open the full presentation →p. 32 — The 2019-2023 combined ratio walk from 113% toward under 100%, split by cost of care, admin and market mix. · Open the full presentation →p. 33 — Markets sorted into grow, maintain and remediate, with the share of direct premium sitting in each. · Open the full presentation →p. 42 — The three +Oscar product families and the payor and provider problems each is sold against. · Open the full presentation →p. 45 — +Oscar's payer administration numbers: claims auto-adjudication, payment accuracy, point systems replaced. · Open the full presentation →p. 57 — How the P&L actually works — premiums through risk adjustment and reinsurance to combined ratio and adjusted EBITDA. · Open the full presentation →p. 64 — Parent cash versus regulated subsidiary capital, and why that split constrains what the holding company can spend. · Open the full presentation →
J.P. Morgan Healthcare Conference 2024 — 2024 · 9 pages · The same story compressed into nine slides five months before the investor day, with a member-provider flywheel diagram. · Open →
Fourth Quarter and Full Year 2022 Earnings Presentation — FY2022 · 13 pages · The last full quarterly earnings deck Oscar published: FY2022 results and the original 2023 guidance. · Open →
J.P. Morgan Healthcare Conference 2023 — 2023 · 11 pages · How the path to profitability was framed entering 2023, under the prior CEO and before the ICHRA pivot. · Open →